At a time when the old broadcast model is collapsing and familiar advertising nostrums are being debunked daily, marketing is in a panic to restore its dwindling credibility as a discipline.
There is pressure as never before to show something for the dollars being spent. Corporate bosses everywhere are insisting on it. Media choices that used to be routine are suddenly being questioned. Budget allocations that were once automatic now have to be rationalized. Marketers keep hearing the pushback: "How do you support that?"
The ethereal benefits of brand building are no longer enough to win over tough-minded CFOs—not when the link to top-line revenue growth is still more theory than fact. And so marketers are anxious to find tangible evidence of their contribution to business performance. The search is on for more meaningful metrics: numbers everyone can relate to—and believe in.
That's why marketers can be heard mimicking the language of accountants, seeding their vernacular with terms like return on marketing investment (ROMI), discounted cash flow, and hurdle rates. Yet no one has truly cracked the code on ROMI. It remains a quixotic pursuit, with no clear way to correlate marketing spending with financial results.
No matter how illusory it may be, the quest for an integrated performance measurement system—one that conclusively establishes the value of marketing—is a priority for many businesses. According to Forrester Research, measurement has become a "battle cry across the marketing industry"; it also tops the list of complicated tasks.
A recent survey jointly conducted by Forrester and the Association of National Advertisers (January 2005) found that 80% of respondents could not even agree on a common definition of marketing ROI, let alone a method of computing it. And because ROI is expressed as a ratio, there is a hidden risk that goes with it: the measure looks just as good when the cost denominator is reduced.
In his book Marketing ROI (McGraw Hill, 2003), James Lenskold states that "without question, smarter marketing can generate more profitable returns, so it's time to manage the budget as an investment and not as an expense." He adds: "The key to using marketing measurements effectively is to understand how the measurements relate to one another."
Line of Sight
In the past, all marketing management ever really cared about was driving up market share and sales orders—because that is how they were judged from one quarter to another. Brand nurturing companies might also pay heed to intermediary measures such as top of mind awareness and purchase intent, seeing them as lead indicators. But until recently, much of what has passed for marketing measurement has been street-level reporting: gross ratings points, coupon redemptions, Web site visits, direct mail responses, trade show leads, and the like.
No marketer can hope to show that any one tactic is more financially advantageous than another. How, after all, does anyone prove the merits of in-store signage over outdoor advertising? Collateral support versus event sponsorship? Product sampling versus promotional contests? Those decisions always get made through a subjective mix of instinct, professional bias, guesswork, industry practice, agency prodding and, oh yes, past resul—if they can even be obtained.
The real question is whether the cumulative marketing investment is paying off. Just as important is figuring out the most appropriate balance between the acquisition of new customers and the retention of existing ones. Too often, the allure of mass advertising has deprived the best customers of the attention and stroking they deserve. But with the deconstruction of mass media, the rapid rise of interactive marketing, and the realization that the customer experience matters, CRM is in vogue again. The result: an even greater diffusion of media spending, making the measurement labyrinth that much more complex.
Some leading marketing organizations, particularly in the consumer packaged goods sector, think that the solution lies in market mix modeling. According to Forrester, it has become the preferred measurement technique, with more than 40% of marketers planning to adopt it in future.
First introduced in the 1980s, market mix modeling uses time-series regression to weight the various activities that drive sales, such as advertising campaigns and in-store promotions, and then predicts the impact of using various combinations of media. The model is reliant on a rich source of historical data spanning 2-3 years (usually drawn from POS systems). The drawback to this method is an undue emphasis on short-term results, which gives promotional tactics an undeserved edge over investments with a longer payback (such as loyalty building). Anything that causes a sharp spike in sales is interpreted as a win. Yet that revenue may not be sustainable—in fact, it may undermine the brand franchise by encouraging excessive discounting.
An alternative approach, favored by CRM practitioners, is to model customer value instead of brand sales. In their forthcoming book Return on Customer, Don Peppers and Martha Rogers observe that "a company is, at its roots, a portfolio of customers, who not only buy things from the firm in the current period, but also go up and down in value." Therefore, the most important indicator of business health, they posit, is the current period cash flow from customers plus projected changes in their equity (i.e., lifetime value).
In modeling customer value, the dependent variable is the cash flow from active customers. Linear regression modeling can be used to score customers on their projected spending, factoring in attrition probability, purchase frequency and seasonal or lifecycle related spending patterns, all based on behavioral observations.
The level of marketing investment can be adjusted by customer segment to allow for variable revenue streams over the short- and long-term. If there is a sudden dip in the repeat purchase rate of first-time customers, or a bump in voluntary attrition, it will show up as reduced cash flow, signaling the need for action.
Whether the ROI modeling is done at a brand or customer level (likely both), these methods lead to more prudent decision making and resource allocation. What they cannot do is push marketing measures into the executive line of sight. For that, a different solution is required: a performance scorecard.
Cause and Effect
The concept of a strategic scorecard was first broached in a seminal 1992 Harvard Business Review article by Drs. Robert Kaplan and David Norton. They saw the need for a measurement system that would go beyond financial metrics to incorporate both outcome measures (performance results) and lead indicators (performance drivers). They called their idea a "balanced scorecard"—and it has since won widespread acceptance as an enterprise tool to align strategic direction and priorities.
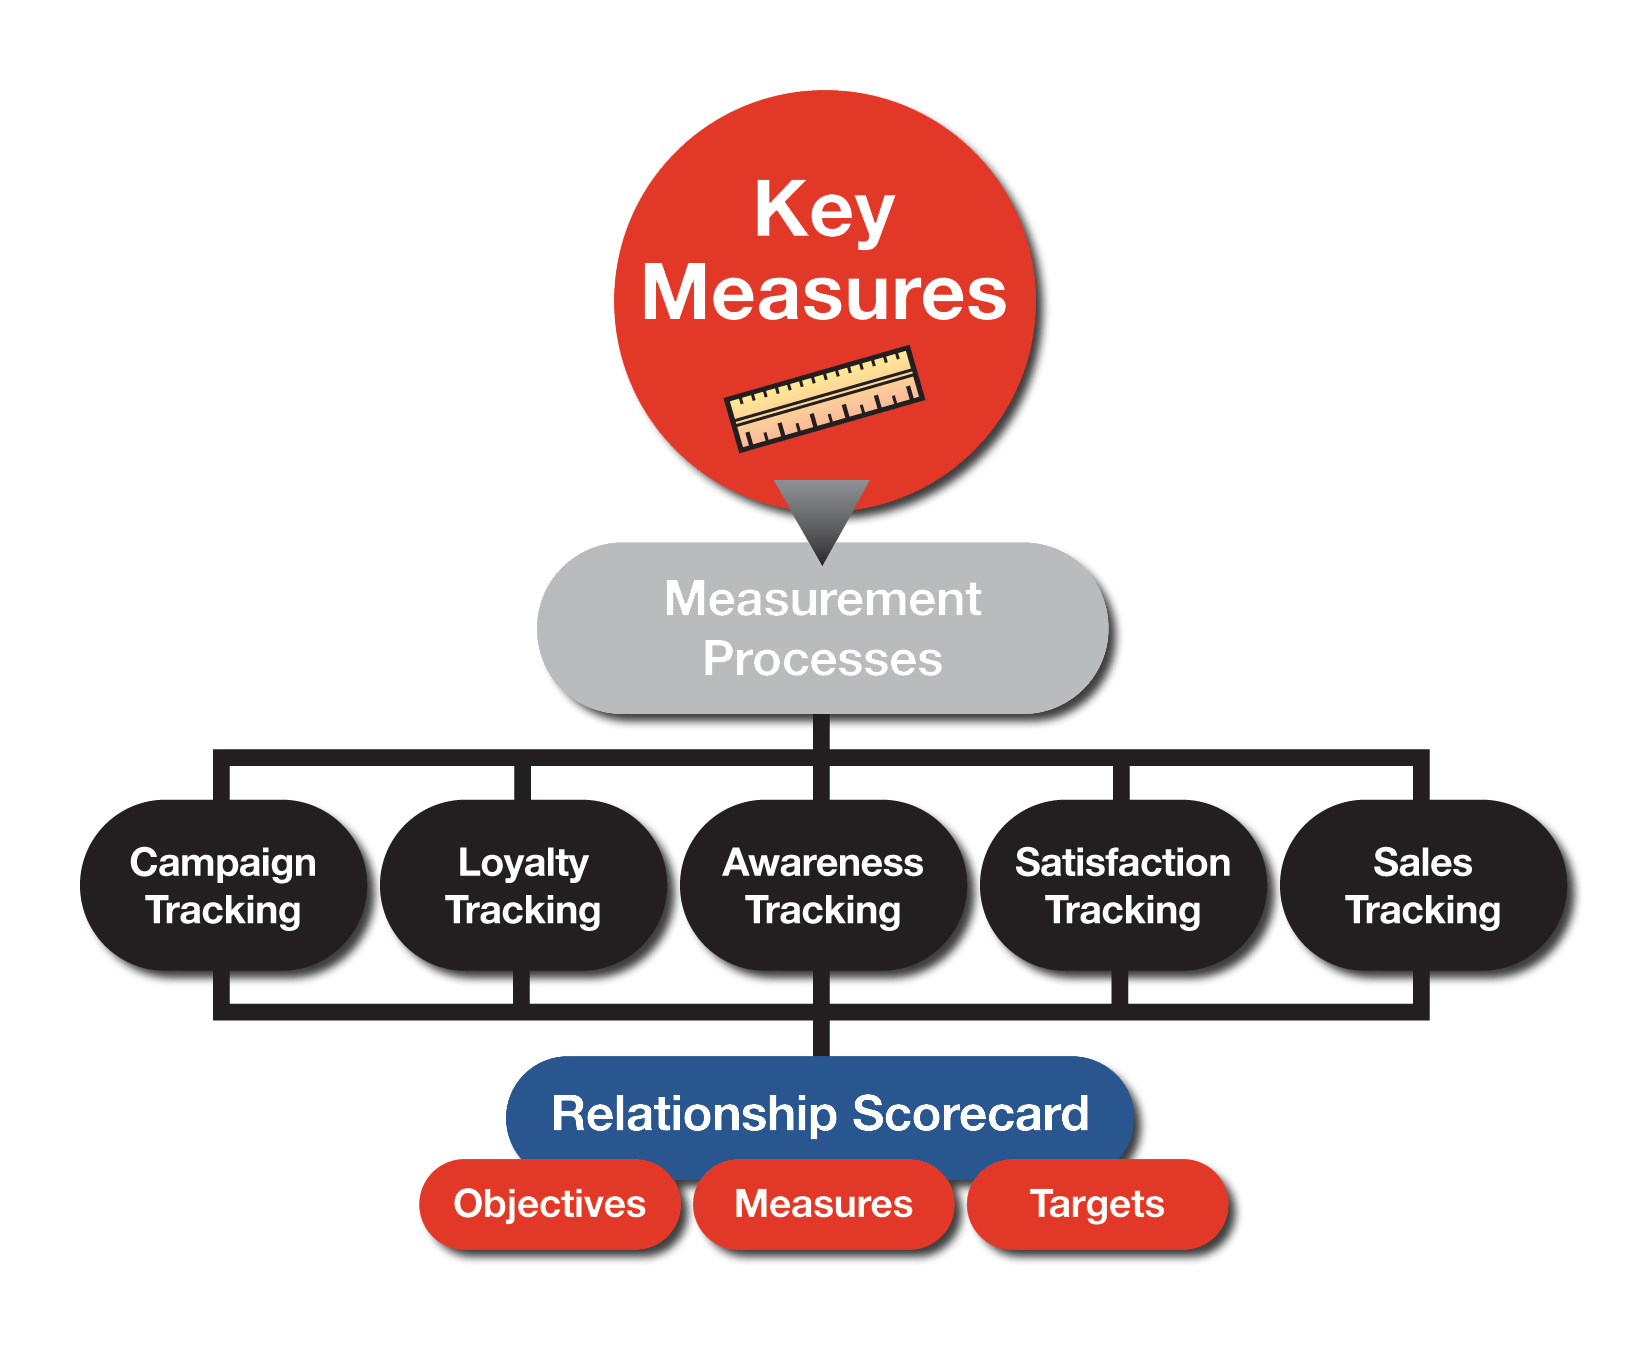
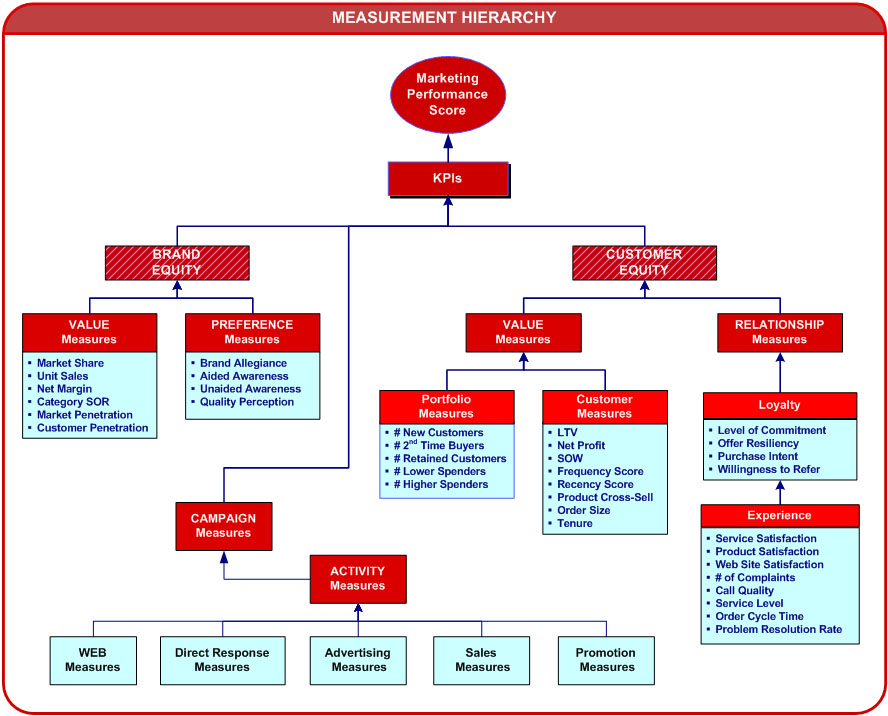
A marketing scoreboard is simply an extension of that concept. It is made up of a set of cascading measures that can be rolled up into a composite score. For each key performance indicator (KPI), progress is charted by comparing actual results to budgeted targets, baseline indices, and industry benchmarks:
The advantage of deriving an aggregate score is that it can be easily correlated with financial results to show cause and effect, eliminating the need for abstract interpretation. The weighted elements of that normalized score would include a mix of measures related to brand strength and the asset value of the customer portfolio. These might include a product cross-sell ratio, a customer referral index, a share of requirements ratio, a loyalty and satisfaction score, the customer retention rate, a repeat purchase conversion rate, a brand development score and possibly several other KPIs—no more than 10 or so—each weighted according to importance.
A second tier of the scorecard would include two types of soft (attitudinal) measures: the first having to do with brand equity—that is, top-of-mind awareness, perceptions and preference—and the other having to do with customer equity: the willingness to stay loyal to the brand based on the experience with it. Brand equity is most directly influenced by product quality and ambient marketing noise, while customer equity is affected by relationship factors such as treatment, rewards and recognition.
The third tier of the performance scorecard would capture and summarize measures reflecting the daily level of customer interactions, ranging from Web site visits, to email sign-ups and click-throughs, to call center inquiries and complaints, to direct mail responses. Preferably, a set of measures would be associated with specific marketing programs, providing a bottom-up view of campaign results.
At a Glance
To visualize and interrogate all of these measures—and to understand the correlations and interdependencies—a scorecard reporting application or dashboard is needed. C-level executives need a quick high-level snapshot of the situation (thus the importance of parsimony in choosing KPIs), while marketing management requires a flexible drilldown path to explain budget deviations.
A dashboard is simply a visual interface featuring various graphical devices that provide instant clarity by highlighting trends and variances. It can take the form of a simple "at a glance" Web portal or it can be a specialized business intelligence (BI) application (e.g., Brio Metrics Builder) offering the functionality to define threshold alerts, metrics and strategy maps.
Like any BI project, the development of a scorecard requires plenty of due diligence up front: for each key metric, a profile should be developed, outlining the purpose, definition, data source, thresholds and rules. And depending on refresh frequency, data quality and the number of feeder systems, the underlying architecture needs to be carefully thought out; otherwise, the reporting system will suffer from slow throughput and will always be a step or two behind actual results.
By showcasing the effectiveness of marketing spending, both in stimulating sales and increasing customer value, a properly built scorecard should be able to deliver what marketers have long sought: respect throughout the organization as a legitimate discipline.


