How do you know what product sales are driven from which keywords within your paid search efforts?
Which keywords are driving the most profitable traffic?
Are you doing everything to maximize your paid search ROI?
A common perception within the online advertising community is that a successful ad sells product it was intended to sell. Surprisingly, that is not always the case. In reality, online conversions often originate from traffic generated by keywords that are entirely unrelated to the items eventually purchased.
For instance, a large percentage of fur coats on one merchant's site were purchased by people who searched on "gold watches." Who would have thought gold watches and fur coats are related?
Are these conversions completely random, or do trends exist within them that can be leveraged to maximize your online revenue? Read on to find out.
Online conversions often originate from traffic generated by search engine terms that are entirely unrelated to the items eventually purchased. Optimal keyword management recognizes these relationships, automatically allocating spend among those terms that convert at the target profit goal.
ClickShift conducted a study to understand these relationships. The goal of the study was to isolate the effect of paid search advertising for one product or type of products on the sales of other products, without results being skewed by branding or search terms that could be deemed related to all categories.
The data used for this analysis consisted of 1,056 initial conversions that originated with generic Google searches and paid advertisement clicks, performed over three months. The advertisements and purchases spanned several categories, including homewares, technology, jewelry, wristwatches, fitness, clothing, and cosmetics.
Results and Discussion
Several challenges arise when analyzing this sort of complex data. The data tables in this paper show the most interesting portions of the data collected and also illustrate the challenges inherent in "cutting" data to reveal significant relationships.
A. The Data: The First Layer
The most basic question that the data answers is exactly how many of the 1,056 conversions originated from keywords unrelated to the products purchased. This relationship could not be calculated by simply summing the cross-category conversions using the category distinctions assigned to advertisements and products by the advertiser. Some categories like "Homewares" are far broader than others like "Wristwatches." Hence, a Wristwatch category purchase is always going to be related to another purchase within the Wristwatch category, but two Homewares purchases are not always going to be related.
Due to this lack of continuity, the method chosen was to label all cross-category conversions as unrelated and then manually compare the query keyword to the product purchased for all of the same-category conversions. These were the results:
Table 1: Related and Unrelated Conversions—Manual Keyword Comparison
| Count | Percent of | |
| Unrelated Conversions | 466 | 44.12% |
| Related Conversions | 590 | 55.87% |
As the table shows, a surprisingly large portion of conversions in this sample were unrelated conversions. These results are quite contrary to the thinking that specific, targeted keywords sell the products they advertise. Instead, this data indicates that nearly half of generic conversions result from unrelated keywords.
B. The Data: The Second Layer
Next, it's interesting to see how many conversions were cross-category conversions:
Table 2: Cross-Category Conversions—Category Comparison
| Count | Percent of | |
| Cross-Category Conversions | 411 | 38.92% |
| Same-Category Conversions | 645 | 61.07% |
A quick comparison between Table 1 and Table 2 shows that there were 55 same-category unrelated conversions. This represents 5.2% of the whole sample, a small enough percentage to ignore for the benefits offered by using cross-category conversions as a proxy for unrelated conversions, when searching for trends within the user behavior.
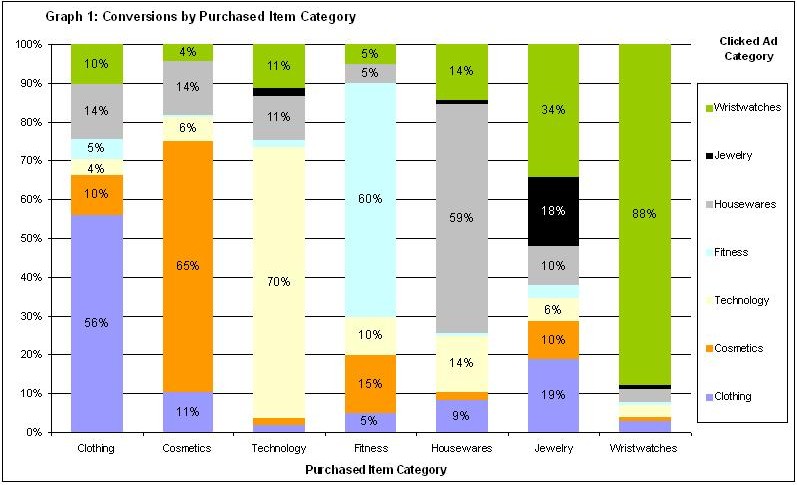
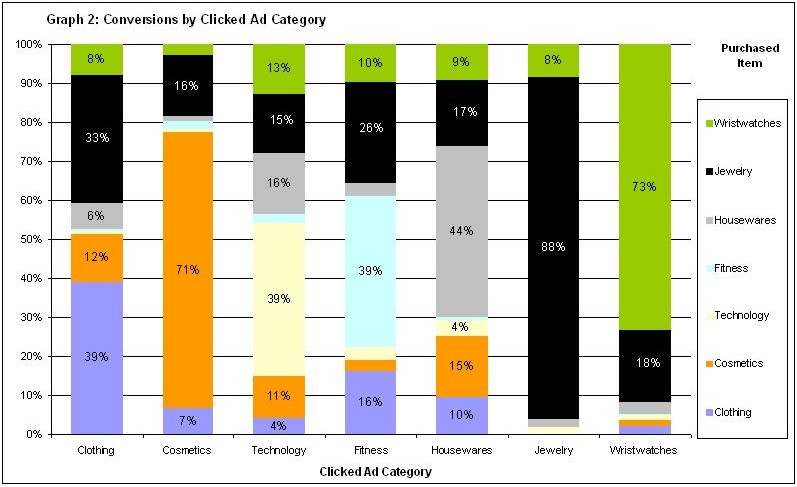
However, searching for such trends is not straightforward since the data shows where conversions came from, but all of the categories saw different numbers of clicks and conversions. For example, while 39% of Clothing ad clicks that converted resulted in Clothing category product purchases, this 39% was actually 56% of Clothing purchases. These somewhat counterintuitive relationships are seen in the two graphs below:
Click to enlarge
Click to enlarge
While the relationships between Graph 1 and Graph 2 are somewhat counterintuitive, there are several interesting trends that can be seen within them.
The most obvious trend, in Graph 2, is the tendency of users to purchase within the Jewelry category, no matter what category of advertisement was clicked. This is a trend that would be expected within categories like Clothing, Wristwatches, and perhaps even Cosmetics, due to the similarities in products and the people who would tend to purchase within them. However, this trend is very surprising to see within categories like Technology and Fitness. This phenomenon may be due to a residual branding effect, where users who clicked on these dissimilar category advertisements did so consciously or unconsciously, knowing that there was a robust jewelry selection on the site. It could also be an indicator of the preferences of those who click paid search advertisements generally. However, no matter what the source of the preference may be, this relationship could be valuable if understood by the retailer, especially when examined alongside the average revenue per conversion by category:
Table 3: Weighted Average Revenue per Conversion by Category
| Category | Average Revenue |
| Wristwatches | $243.16 |
| Jewelry | $212.63 |
| Cosmetics | $58.84 |
| Homewares | $262.73 |
| Clothing | $111.24 |
| Technology | $846.71 |
| Fitness | $203.08 |
Specifically, since Jewelry is the category of goods most likely to be purchased on impulse and is also the category with relatively high revenue per conversion, this retailer may want to engineer their site so that jewelry is highly visible and easy to purchase at all times. This simple change to the site would allow the merchant to significantly increase revenue. To this end, the analysis is useful to illuminate several flaws inherent in typical approaches to online ad spend management.
C. Typical Approach #1: Allocate spend to ads that get clicked
A common advertising methodology, and one encouraged by major search engines like Google, is to direct spending toward advertisements that get clicked the most. Advertisers in this camp interpret clicks on an ad to be affirmations of the value of that ad. They assume that the traffic these ads generate is the best traffic for their site, similar to the way traditional advertisers would likely purchase magazine advertisements that generated the best response from viewers.
This approach to advertising fails to fully harness the performance metrics available to online advertisers. Clicks alone indicate traffic generation but fail to identify how much revenue the cost of the click generates for the advertiser. Directing spend toward click traffic is a sub-optimal bid management method when trying to generate profits from online advertising.
Advertisers that allocate advertising spend to just driving click traffic, but are blind to the quantity and value of conversions, cannot accurately calculate how much each click is worth to them.
D. Typical Approach #2: Allocate spend to ads with improving CTR
Another approach to advertising online, also encouraged by major search engines like Google, is to orient advertising toward improving click-through rate. The flaws in this approach are the same as those inherent in orienting campaigns towards click volume. Without knowledge of what revenue a paid advertisement click produces, it is impossible to value how much that particular click is worth and how much to pay for it. Furthermore, since advertisers generally pay for clicks, not impressions, click-through rate should essentially be a non-factor* in determining where to direct spend. Without a linkage between ad cost and ad revenue, advertisers cannot make informed decisions regarding advertising spend.
E. Typical Approach #3: Allocate spend toward products that sell
Another approach employed in traditional advertising is to scale advertising toward best-selling products. The basic thinking here is that the sales themselves are good indicators of the factors driving revenues. Much like their brick-and-mortar counterparts, some online retailers believe that the products sold on their site indicate what is drawing traffic into their site in the first place. Most advertisers who blindly scale advertising toward products that sell run a significant risk of hurting the overall performance of their campaigns. Within this sample there were 240 conversions in the "Jewelry" category, which represent 22.72% of the total sales from the period, shown here:
Table 4: Clicked Ad Category and Purchased Item Category Breakdown
| Category | Total Ads Clicked | Percent of Total Ads Clicked | Total Conversions | Percent of Total Conversions |
| Wristwatches | 453 | 42.89% | 379 | 35.89% |
| Jewelry | 49 | 4.64% | 240 | 22.72% |
| Cosmetics | 147 | 13.92% | 161 | 15.24% |
| Homewares | 142 | 13.44% | 105 | 9.94% |
| Clothing | 140 | 13.25% | 98 | 9.28% |
| Technology | 94 | 8.90% | 53 | 5.01% |
| Fitness | 31 | 2.93% | 20 | 1.89% |
A retailer basing his advertising spend on sales alone would potentially, as a response to successful sales in the Jewelry category, increase Jewelry advertising spend at the expense of categories that saw fewer conversions, such as "Clothing." However, this move can potentially hurt Jewelry performance because Clothing advertisements actually produced 19.16% of the Jewelry conversions while Jewelry ads only produced 17.91% of Jewelry conversions, a trend shown in Graph 1 and Graph 2 above.
Thus, a reduction in advertising for a category like Cosmetics is very likely to reduce Jewelry conversions and it is unclear whether a proportionate increase in Jewelry advertising would make up for the loss. The only way to know is through iterative experimentation examining the relationship between specific ad spend and specific sale revenue.
Advertisers basing spend on revenue generation alone would be utilizing a sub-optimal approach because they are not factoring in conversions generated from unrelated keywords and advertisements.
F. The Benefits of Profit-Based Optimization
The data and examples above illustrate the significance of the relationship between ad cost and revenue generation, and the importance of using this data to measure the return on ad spend—ROAS (ROAS = Revenue Generated from Advertising/Cost of Advertising)—for a particular ad. They also show that the relationships between ad clicks and product sales are, on average, non-intuitive and unrelated to the initial search query.
However, the level of analysis necessary to truly optimize ad spend is time-consuming and tedious. For all but the smallest of online advertisers, tens to hundreds of hours per week dedicated to multivariate statistical analysis are necessary to calculate and implement the true optimal spend for each aspect of an online advertising portfolio. Further, whenever a click or conversion occurs, the optimal bid for an ad changes. Additionally, some site landing pages and ad texts can be more successful than others in different situations, so they too can be optimized. In short, if your campaigns are large enough to warrant tracking of cost, spend, and ROAS (all but the smallest are), the amount of available informative data produced quickly renders human calculation impotent.
The complexity involved in effectively calculating and implementing efficient spending is ignored or unknown by many, including Google, which recommends improving return on ad spend by focusing "ads and keywords and sites to attract the right audience" and advises "to be sure your landing page and site are set up to let users find what your ad offers." While these factors are important, they are just the first steps toward understanding how to maximize returns.
What is needed is a system that automatically tracks ROAS by associating advertising costs to revenues in as close to real time as possible. This system would also automatically track the impact of different landing pages and ad creative, using multivariate statistical testing to optimize the advertising and spending towards a pre-designated business goal. If an advertiser indicates that maximizing ROAS is the goal of its online advertising, the system continually evaluates all advertising costs within the campaign and compares them to the revenues generated by each expense, along with the various successes and failures of landing pages and ad texts, and continually calculates and implements the appropriate spending levels, landing pages, and ad copy for each facet of the advertising campaign.
This automated approach ensures that the amount and allocation of spend is always optimal and eliminates the need for slow, error-prone human calculation, analysis, and implementation.
Conclusions
The data herein demonstrates how a large portion of online conversions often originate from site traffic generated by search engine queries and subsequent paid advertisement clicks that are entirely unrelated to the items eventually purchased. These conversions are not random, and, when identified, patterns and trends within them can be leveraged to maximize online profits.
Optimal ad campaign management recognizes and utilizes the relationship between these non-intuitive keyword-conversion relationships and automatically allocates spend to maximize return on ad spend from these relationships.
* CTR may be a factor in the Google Quality Score, which impacts ad position and thus could potentially be a factor in campaign decisions.


