Understanding customer behavior is key to creating marketing campaigns that generate high response and revenue.
One of the best ways to understand customer behavior is to study customer migration patterns—to learn when and why a customer ends up in a segment different from the one he or she had been in.
The starting point for those studies is your customer-segmentation model. After you decide which approach to use to measure migration, the process is a virtuous circle of analyze, segment, campaign, and analyze again.
The next task, requiring strong analysis skills, is to tie the observed migrations to company activities, such as a marketing stream, and to customer purchase behavior.
The final task is to apply the results of that analysis to your marketing campaigns to generate revenue and boost customer retention.
Why Study Migration Patterns?
Customers are not statues, cast in stone and plunked down in a park as a perch for birds. Some buy a lot, and some defect to the competition.
Though you likely have some very steady buyers, most customers are in motion. That is not a new notion. We wrote about it four years ago in the Target Marketing magazine article "The Five Laws of Velocity Marketing." Today marketers refer to that behavior as customer migration.
We study customer-migration patterns because they help us understand customer behavior and ultimately increase sales.
We want to know why some customers defect and others remain loyal. We want to know how to allocate the marketing budget to get more customers moving up in our rankings than there are customers moving down.
We want to sell more goods and services. We want to maximize our revenue and marketing return on investment (ROI). What we learn from migration patterns can help with all those tasks.
The Role of Customer Segmentation
Migration implies movement from here to there. In marketing applications, the "here" and the "there," where a customer started and where the customer is now, respectively, are defined by the customer groups, or "segments," to which the customer is assigned.
The metrics used to define segments and the values of those metrics, which differentiate one segment from another, come from an analysis of the purchase transactions of the customer population.
The process of making the segment assignments is called "customer segmentation." Choose whichever metrics serve your marketing goals at the time. A customer's migration to a new segment usually suggests a marketing opportunity.
Customers could be segmented by their body weight (which might be important for a specialty-clothing retailer), by how they respond to a survey, by demographics such as ZIP code, or by their buying behaviors.
The most useful and predictive way to segment customers is by buying behaviors. Even choosing to segment by buying behaviors leaves a lot of wiggle room. Perhaps the most popular behavioral metric is Recency—how many days since a customer's last purchase.
Some companies use revenue, dividing customers into groups according to how much they have spent over some reasonable period. Another frequently used methodology is RFM (a combination of Recency, Frequency of purchase, and Monetary value, or revenue).
We use a sophisticated measure called Loyalty Rank and explain in another whitepaper, RFM vs. Loyalty Builders' Modeling why that metric is more accurate and more predictive than others.
Obviously, the set of metrics that is used for the segmentation can affect the segment into which a customer will fall and how the migration patterns will look. Since our ultimate goal is to increase revenue, the objective is to choose a segmentation model that supports an effective, differentiated contact strategy.
By marketing to each segment according to its characteristics, we are able to craft the best message for each customer group and maximize total revenue.
Two Ways to Measure Customer Migration
There are two ways to approach the measurement process. In the first, think of the segments as a set of buckets. Count the population in each bucket at the start of the period being studied and then count the population in each bucket at the end of the period.
Differences between the counts reflect migration by segment. Figure 1 is a real-life example of a migration report using the first approach.
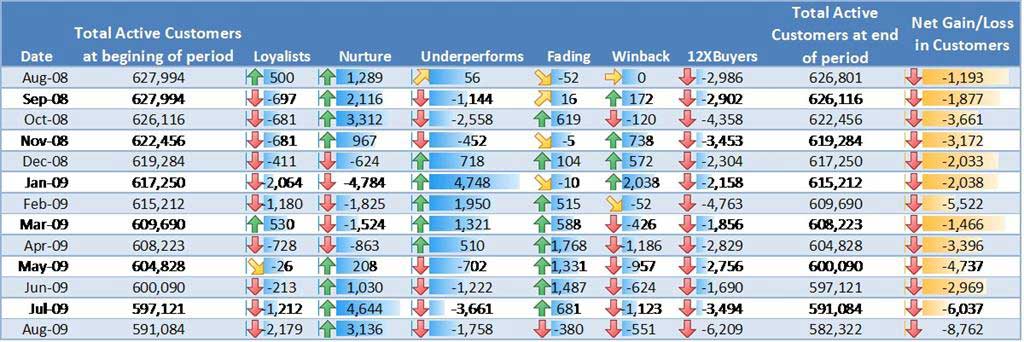
This company has seven segments:
- Loyalists
- Nurture
- Underperforms
- Fading
- Winback
- Onetime and two-time buyers
- Inactive
The best customers are the Loyalists. The lowest-ranking customers are in the Inactive segment. Typically, one-time and two-time buyers are pulled out and treated separately, but they are a very important segment that contains potentially excellent customers as well assome who are just passing through.
The segments in the example are defined by customer scores on two metrics: Loyalty Rank (sometimes called LRank) and Risk Score (sometimes called Risk Probability); check out definitions in this glossary.
Analysis and segmentation occur monthly, and the population in each segment is counted monthly, with the most recent month at the bottom. The cells show how the segment population has changed compared with the previous month.
For example, in August 2009 the number of customers in the best segment, Loyalists, dropped by 2,179 compared with the number of Loyalists in July. Apparently, many customers moved down one segment to Nurture, for that segment gained 3,136 customers. Also, the top group and the third group (Underperforms) apparently have been losing members for the past four periods, and the second group has been gaining members over that same period.
The report is easy to calculate and at first glance seems to show some meaningful information. Did the gain in the Nurture group come more from improving Underperforms or sinking Loyalists? Did the last month's drop in one-time and two-time buyers come from a decrease in acquisition activities, or did those customers just go inactive? It is hard to answer those questions using the bucket approach.
A Better Way
For the second approach, think of the segments at the start of the period you want to track as a set of cohorts. Each cohort is a group of customers with approximately the same characteristics at the start of the study period.
Using cohorts is different from using buckets. With cohorts, we follow the same group of customers over time, focusing on the customers as they move in and out of different segments (containers).
With buckets, we focus on the container, the segment definition or "bucket," and different customers move in and out of our containers.
We follow each customer in the cohort over time and report where that customer was and where the customer went. Figure 2 shows a report using the cohort-oriented approach.
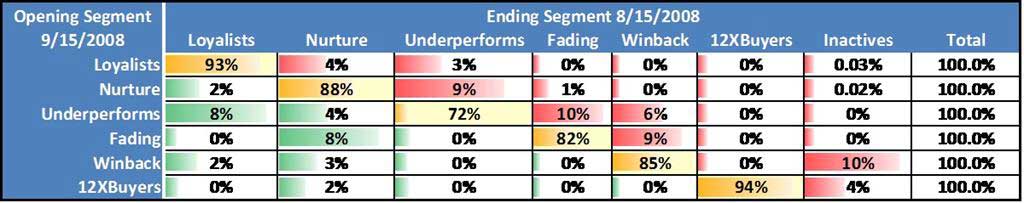
Read the table from left to right, across each row/cohort. It shows what percent of a cohort's population ends up in the other segments at the end of the period studied.
Using the cohort approach requires that every customer in the cohort be accounted for, so the total on the far right needs to be 100%. Green cells show where customers have moved to a higher segment, yellow cells show customers staying in place, and red cells denote customers who are moving to a lower segment.
For example, 82% of the Fading group were still in the Fading group at the end of the period, and 8% had climbed to the Nurture group, probably as a result of a campaign aimed at the Fading group. Similarly, 7% of the Loyalists dropped down to Nurture or Underperforms. That is a typical mobility pattern, with most of the movement coming from customers in the middle segments (Nurture, Underperforms, and Fading).
Although a cohort-oriented approach requires more work, it has two big advantages: It is easier to see exactly (1) which customers are migrating and (2) where they are going. That additional information is crucial to understanding why customers have migrated.
How to Track Migration Patterns
The process of tracking migration is not complex. Here are the steps:
- Analyze customer transaction behavior.
- Pick a customer segmentation model, and segment your customer population. Use the metrics from the transaction analysis.
- Pick the cohorts you most want to affect or most want to study: You will have the most influence on the Underperforms and Fading; Loyalists will include the bulk of your revenue producers, so include them, too.
- Market to your selected cohorts: Use messaging that is appropriate to their customer
- Analyze again: When the campaigns are completed, repeat the transaction analysis to see which customers have moved.
There should be two deliverables as a result of this process:
- First, you want a cohort-migration report similar to that of Figure 2. It shows an overview of what happened over the period you are studying.
- The second deliverable is the data table behind the report, showing exactly which customers have migrated, where they started, where they ended, and what they did or didn't purchase during the period.
With those deliverables in hand, you are ready to begin interpreting the results.
Understanding Changes in Customer Behavior
The changes you have been documenting come from two different sources: what your company did and what your customer did. The first category, what your company did, includes the marketing streams, messages, and offers that were directed at the selected customers. The bulk of the follow-on analyses will be to correlate those campaigns with customer purchases.
The second cause of a customer's landing in a different segment is that customer's purchasing behavior—what, how much, and how often the customer bought or, at the other extreme, the customer's lack of purchases.
The customers may or may not have been touched by marketing streams. Their transaction behavior is the basis for any score changes that land them in a different segment, so the descriptions of migration patterns will be in terms of those score changes and transactions.
For example, there might be sentences in your analysis such as this: "Most of the customers who dropped from Underperforms to Fading failed to respond with a purchase to either the fall sale brochure or the associated email campaign."
At that stage in the migration analysis, you know what happened—which customers moved where. And after careful analysis of the various events, you have some insight into what caused their reclassification.
Applying What You Have Learned
Now it is time to make some more money by applying the results of migration analyses.
You know what worked and what didn't, because you've determined which segments you were best able to influence with your marketing streams; now it's time reallocate your marketing budget to leverage that learning.
The budget could change, the messaging could change, and the delivery channel (direct mail, email, sales call, etc.) could change, too. A typical result is that top segments will continue buying with only maintenance-level campaigns, but mid-tier segments are much more responsive to campaign stimulus. So shift the budget to the mid-tier segments; your revenue and marketing ROI will rise accordingly.
Another application comes from analyzing risk-score effects. Migration-pattern analysis can show at what risk-score values customers begin the downward slide to defection. Customers approaching that threshold should be receiving offers to stop the negative movement.
Looking for correlations between specific product purchases and customer movement is also useful, especially in the middle tiers, where incremental revenue is more easily found.
Since migration analysis is a quantitative discipline, another aspect of your applications should be continual testing. Can you temper the downward drift of some customers? Can you improve the rate of upward migration, with corresponding revenue gains, to the higher segments?
The key to insightful testing is to understand how to build proper control groups. If you want to test your marketing materials, choose your controls from the same segment or cohort as the treated group. They will have the same propensity to buy but will not have received the messages and offers.
If you want to test your customer segmentation model or how you build your cohorts, choose your controls from another segment. Get help if necessary, but get started testing.
Beyond testing, you should develop a plan to regularly monitor customer-migration patterns. Components of your plan should include, besides testing, continual analysis and segmentation. Use a system to automate the process. You will soon see the rewards as your revenue numbers climb.
Summary
Migration analysis is an excellent tool to grow revenue, improve customer retention, and stop customer defection. It requires regular analysis of transaction behavior, a solid customer segmentation scheme, a cohort-based tracking approach, and continual testing. The resulting performance improvement is well worth the effort.


