Boosted by newer advertising channels and increased marketing activity, ad spending is forecast to increase on average 0.6% in 2011 from 2010 levels, with outlays led by the diversified food products, pharmaceutical, and telecom industries, according to Schonfeld & Associates, Inc.
The diversified food products industry is projected to lead in ad spending, reaching $30 billion in 2011, up 1.2% from 2010 levels.
In contrast, spending in the auto industry is projected to decline 8.5% in 2011, to $18 billion, with annual sales in that industry also expected to fall (9.6%). However, Daimler, Fiat, Ford, General Motors, Honda, and Toyota will each spend over $1 billion in advertising, according to the forecast.
Nestle is expected to remain the top ad spender in 2011, with an estimated budget of $17.3 billion, up 1.4% from 2010 levels.
Below, other projections issued by Schonfeld & Associates.
2011 Forecast
- Pharmaceutical industry ad spending is forecast to exceed $26 billion in 2011, up 5.4% from 2010 levels. The direct to consumer marketing of drugs by manufacturers continues to strengthen pharmaceutical advertising. Biotech and electromedical apparatus industry spending is expected to increase 5% or more.
- Telecom services ad spending is expected to reach $17 billion worldwide in 2011, up 1.3% from 2010. Ad spending for wireless communications services will continue increasing, growing 5.8%, to $24.6 billion.
- In the mobile category, spending by manufacturers of traditional cell phones lags that of smartphone companies, reflecting consumers' switch to the more powerful phones. RIM, the maker of the Blackberry, is projected to increase its ad budget over 22%.
- Among PC manufacturers, the pace of industry wide growth has slowed, except for Apple, which is expected to increase ad spending 11% from 2010 levels.
- Software ad spending is expected to increase 8.9%.
- Semiconductors and related devices ad spending will fall over 10% in 2011, while spending by computer communication equipment manufacturers will decline 1.6%.
- Retail department stores, such as JC Penney and Macy’s, will spend $ 3.2 billion in 2011, down 4% from a year earlier.
- Variety stores, such as Target and Wal-Mart, will increase their ad budgets 1.7% for a total of $7.6 billion in 2011.
- Catalog houses are expected to continue increases in ad spending—reflecting Internet competition—to over $2 billion annually.
- Online stores eBay and Amazon are expected to grow their ad budgets, 5% and 18%, respectively.
- Web portal Google is planning to spend $455 million, up 13% from 2010 levels, while Chinese search engine Baidu is expected to spend $17 million, up 22%. Priceline.com plans to spend $573 million, up 19%.
Looking for great digital marketing data? MarketingProfs reviewed hundreds of research sources to create our most recent Digital Marketing Factbook (May 2010), a 296-page compilation of data and 254 charts, covering email marketing, social media, search engine marketing, e-commerce, and mobile marketing. Also check out The State of Social Media Marketing, a 240-page original research report from MarketingProfs.
2010 Forecast by Industry Sector
Estimated ad spending growth, sales growth, and ad-to-sales ratios* for 2010 were also issued by Schonfeld. Ad spending is now forecast to increase on average 0.6% in 2010 from 2009 levels.
Despite overall weakness in the first quarter of 2010, some industry sectors are expected to increase ad spending significantly in 2010 from 2009 levels: Healthcare ad spending is forecast to grow 5.5%—bolstered by projected sales increases of 5.9% for the year.
Similarly, Oil, Gas, & Chemicals will increase spending 5.6%, as will Healthcare (5.5%), Computers & Software (3.8%), and Non-Health Services (4.4%).
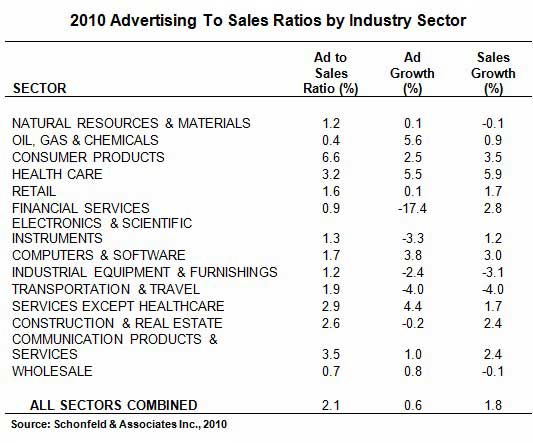
Ad spending in the financial services is expected to drop 17.4% in 2010.
*"Advertising to sales ratio" is defined as the advertising expense divided by net sales (after discounts and allowances) as a percentage. In service industries, net sales are revenue or gross income or other measure used by accountants as the "top line" of the income statement.
About the data: Findings are from the 34th edition of the annual Advertising Ratios & Budgets study by Schonfeld & Associates, which covers more than 4,600 companies across 330 industry sectors. Over 600 major foreign-based firms are covered by this year's study.


