Led by television media spending, total measured advertising expenditures reached $63.6 billion in the first half of 2010, up 5.7% from the same period a year earlier, according to data from Kantar Media. Ad spending during the second quarter of 2010 grew 5.4% over the same period in 2009.
"The rally in ad spending that has emerged from last year's collapse continued at a steady pace through the second quarter, even as softening economic data on retail sales, spending and employment began to raise concerns about the outlook for consumer activity," said Jon Swallen, SVP Research at Kantar Media. "Early figures from the third quarter indicate the advertising expansion is still maintaining its momentum and that is an encouraging sign for the industry."
Below, measured ad expenditure-related data and analysis from Kantar Media.
Ad Spending by Medium
TV media led the first-half rebound:
- Spot Television ad spending jumped 25.1% in 1H10, fueled by robust demand from auto and retail marketers and a cyclical upturn in political advertising.
- Spanish Language TV spending rose 14.6%, with gains driven by the World Cup event in June.
- Cable TV (up 8.8%) and Network TV (up 7.2%) benefitted from selling more ad time and increased spending across a broad range of retail and consumer package goods (CPG) categories.
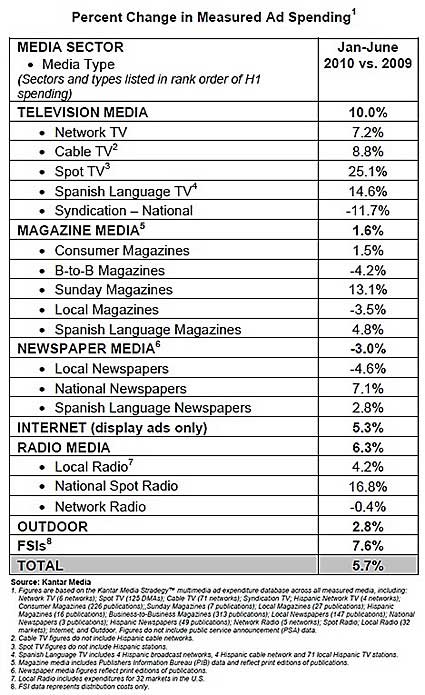
Free Standing Inserts (FSIs) posted the second-largest growth rate among the major media sectors (up 7.6%), as CPG marketers aggressively targeted value-conscious consumers with couponing programs.
In the Radio sector, results were mixed in the first half: National Spot Radio increased 16.8%, while Local Radio was up 4.2%, as telecom and financial service marketers shifted budgets into those segments. Network Radio, however, registered a small decline of 0.4%. Growth rates among all radio types eased slightly during the second quarter.
Consumer Magazine spending bottomed out in March and the ensuing rebound in page counts helped push half-year spending up 1.5%. Sunday Magazines (up 13.1%) continued to reap additional money from prescription drug makers and home improvement retailers. B2B magazines fell 4.2% during the period.
National Newspaper spending jumped 7.1%, primarily from gains at the Wall Street Journal. However, Local Newspaper spending was down 4.6% compared with levels registered a year earlier has now suffered declines for 19 consecutive quarters.
Looking for great digital marketing data? MarketingProfs reviewed hundreds of research sources to create our most recent Digital Marketing Factbook (May 2010), a 296-page compilation of data and 254 charts, covering email marketing, social media, search engine marketing, e-commerce, and mobile marketing. Also check out The State of Social Media Marketing, a 240-page original research report from MarketingProfs.
Ad Spending by Advertiser
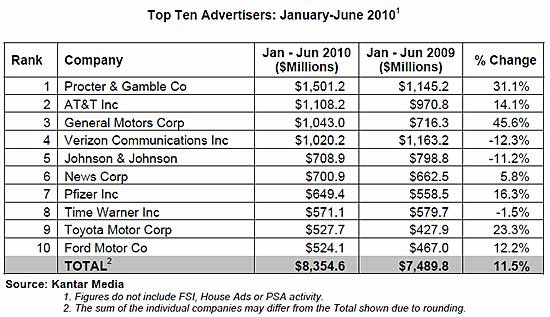
Expenditures among the 10 largest advertisers grew 11.5% in the first half of 2010, to $8.35 billion:
Among the top 10 advertisers:
- Procter & Gamble held onto its position as the largest advertiser and spending $1,501.2 million, up 31.1% over the previous year. The company boosted marketing support for nearly all of its largest brands.
- AT&T was the second spot in the rankings with spending up 14.1%, to $1,108.2 million. Much of the increase was due to a large TV ad buy in February's Winter Olympics, while the second quarter was characterized by significant ad reductions for core wireless products. Rival Verizon Communications slashed its half-year budgets 12.3%, to $1,020.2 million.
- The Top 10 included three auto manufacturers, the most from that sector in more than three years. General Motors had the largest growth rate as the company lifted spending 45.6%, to $1,043.0 million. Toyota Motor, seeking to rehabilitate its image after recalling millions of vehicles for safety hazards, raised its ad budgets 23.3%, to $527.7 million. Ford Motor, which has recently been gaining market share, accelerated its expenditures a comparatively modest 12.2%, to $524.1 million.
Among the Top 100 advertisers, a diversified group representing nearly one-half of the measured ad economy, spending was up 9.7%, to $29.32 billion. The long-tail of small advertisers—those outside the Top 1000 and a segment which accounts for more than one-fifth of all ad expenditures—lagged behind, gaining 1.4% in aggregate media investments.
The skewed distribution illustrates the dependency of the current advertising recovery on large advertisers.
Ad Spending by Category
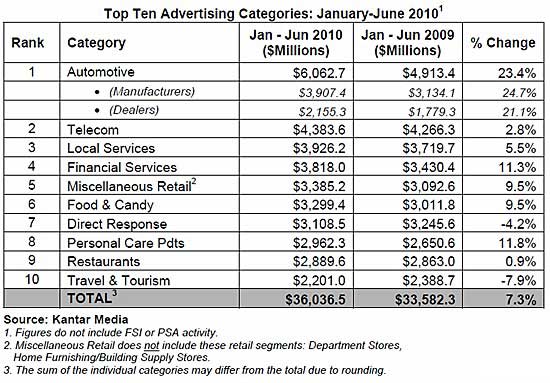
Expenditures for the 10 largest ad categories rose 7.3% in the first six months of 2010, totaling $36.04 billion:
Among the top 10 ad categories:
- Automotive was the premier category in both dollar volume and growth rate: Spending surged 23.4% to $6,062.7 million amid improved vehicle sales. Within the category, manufacturers and dealers had comparable rates of increase.
- Telecom was the second-largest category with half-year spending up 2.8%, to $4,383.6 million. However, spending rates fell during the second quarter as leading wireless and satellite TV marketers pulled back.
- Financial services advertising jumped 11.3%, to $3,818.0 million. Results were helped by vigorous competition among credit card issuers and a marketing revival for consumer loan products. These offset lingering sluggishness in the retail banking segment.
- Packaged goods categories continued to see higher advertising support as marketers adapted their strategies to evolving changes in consumer shopping behavior. Spending in food and candy was up 9.5%, to $3,299.4 million, and spending for personal care products increased 11.8%, to $2,962.3 million.
Branded Entertainment
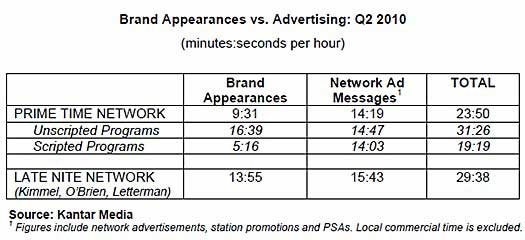
In the first half of 2010, an average hour of monitored primetime network programming contained 9 minutes, 31 seconds (9:31) of in-show brand appearances and 14:19 of network commercial messages. The combined total of 23:50 of marketing content constitutes 40% of a primetime hour.
Other brand-appearance-related findings:
- Unscripted reality programming had an average of 16:39 per hour of brand appearances, compared with just 5:16 per hour for scripted programs such as sitcoms and dramas.
- Late-night network talk shows had an average of 13:55 per hour. The combined load of brand appearances and network ad messages in those late-night shows was 29:38 per hour, or 49% of total content time.
- The top 5 brands ranked by total amount of brand appearance time were Coca-Cola, 24 Hour Fitness Center, Yamaha Music Equipment, Chef Revival, and Starter.
Note: Kantar Media monitors branded entertainment within network prime time and late night programming. The tracking identifies brand appearances and measures their duration and attributes. Given the short length of many brand appearances, duration is a more relevant metric than a count of occurrences for quantifying and comparing the gross amount of brand activity that viewers are potentially exposed to in the program versus the commercial breaks.
About the data: Kantar Media tracks all media (print, radio, TV, internet, social media, and outdoors worldwide) for a full range of media insights and audience measurement.


