Smartphone apps now account for nearly half of the time consumers spend with digital media, according to recent research from comScore.
The 2016 US Mobile App Report was based on comScore audience data as well as data from a survey conducted in June 2016 of 1,049 smartphone users age 18 and older.
Some 49% of consumers' total digital media time is now spent on smartphone apps, the survey found.
Americans spend 73.8 hours, on average, using apps on their smartphones, up from 68.2 hours in 2015.
Adults age 18-24 are especially dedicated users, spending 93.5 hours on smartphone apps per month, on average.
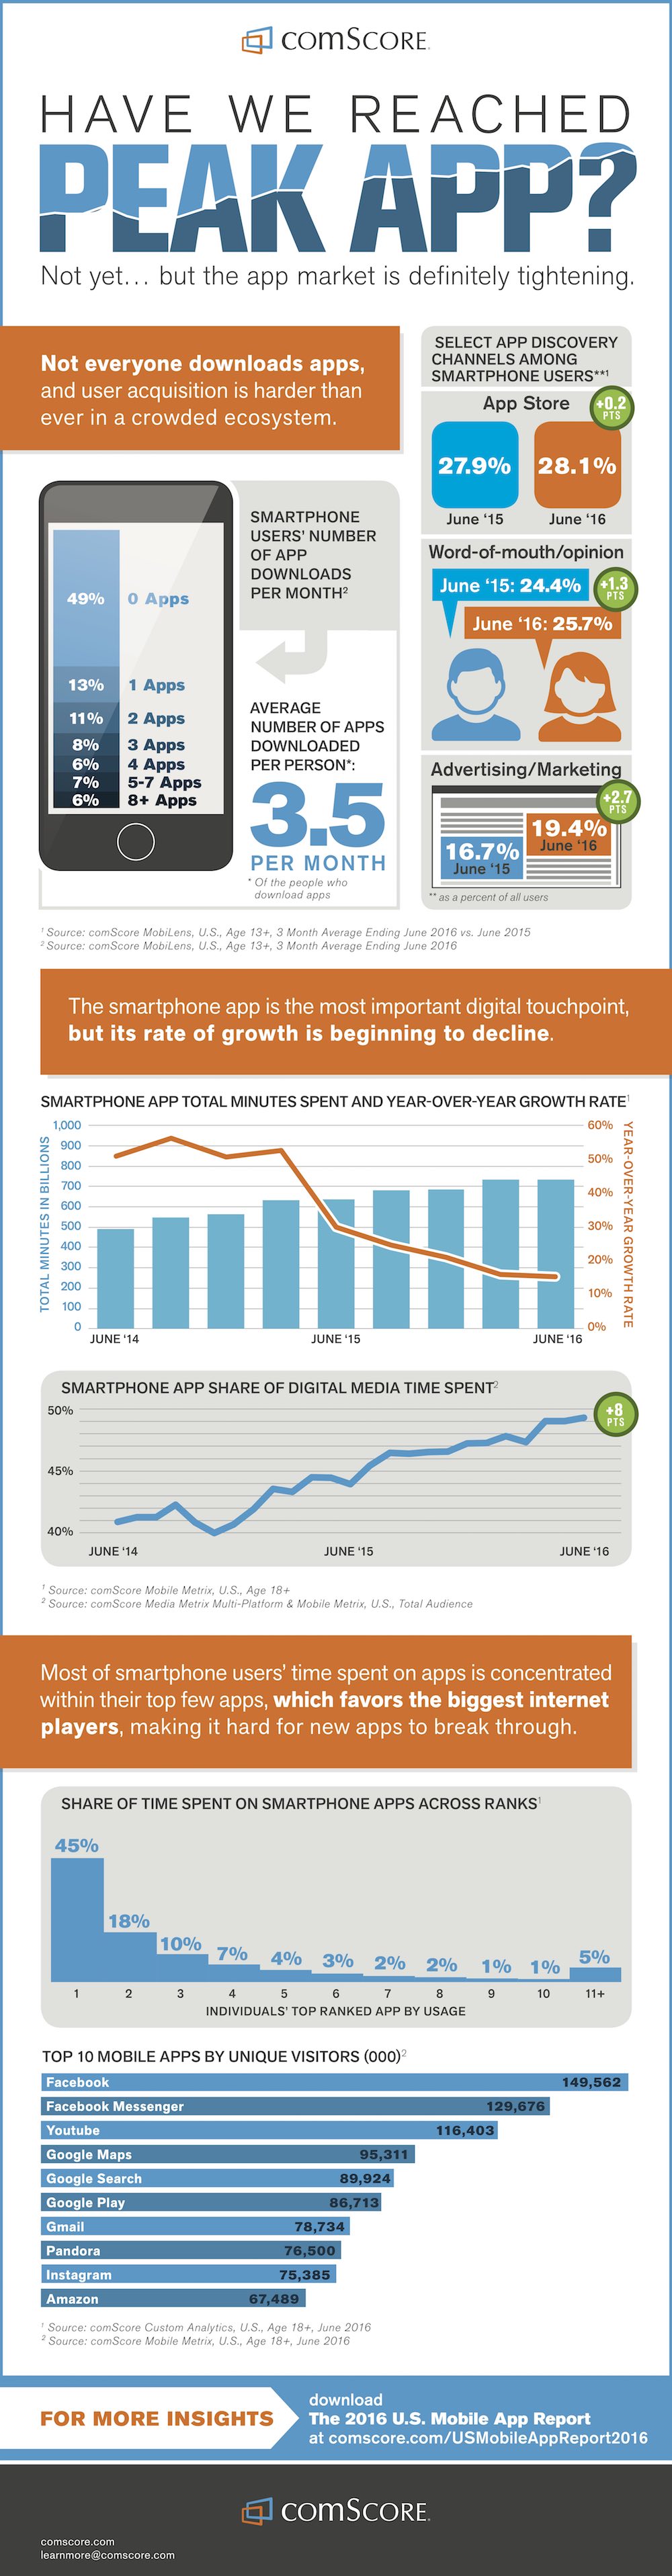
Some 49% of consumers download no new apps per month, on average; 13% download only one new app per month, on average.
A single program accounts for 45% of smartphone users' app time, on average, the analysis found.
Check out the infographic below for more findings from the report:
About the research: The 2016 US Mobile App Report was based on comScore audience data as well as data from a survey conducted in June 2016 of 1,049 smartphone users age 18 and older.