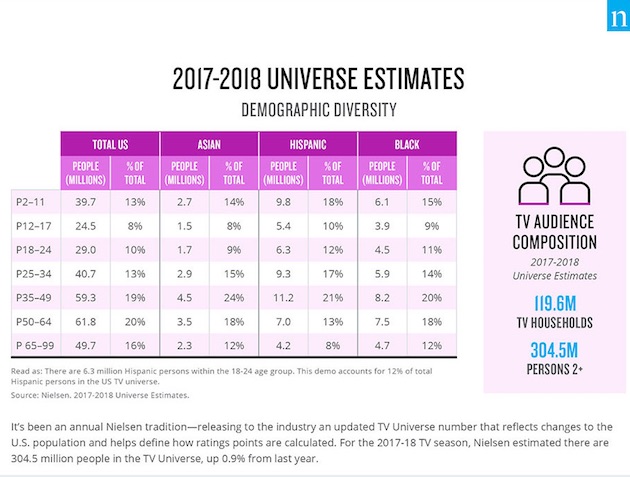
The US television audience for the 2017-2018 season consists of 304.5 million viewers and 119.6 million households, according to a recent study from Nielsen.
The report was based on Nielsen data from 2013 through the first half of 2017.
The "TV Universe" (people age 2+ whom Nielsen includes in audience estimates) this season is up 0.9% compared with last season.
The largest US television audience age group is people age 50-64 (61.8 million people; 20% of the total).
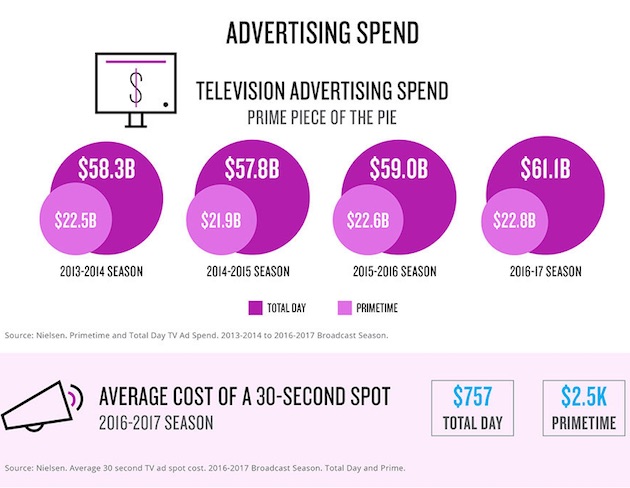
US television advertisers spent an estimated $61.1 billion in the 2016-2017 season; $22.8 billion of that spend went toward ads which aired during primetime.
The average cost of a 30-second spot during the 2016-2017 season was $757 for total day and $2,500 for primetime.
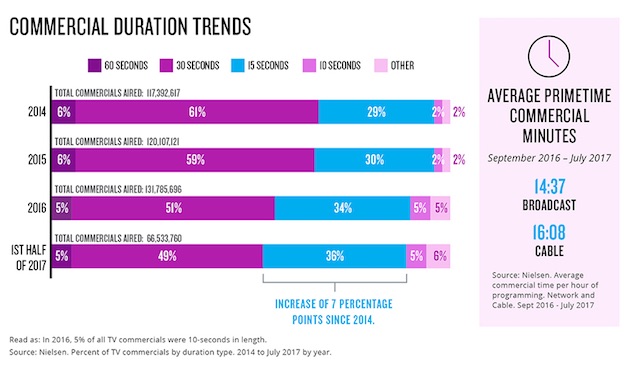
Some 49% of television ads that aired in the first half of 2017 were 30 seconds long; 36% were 15 seconds long—up seven percentage points from 2014.
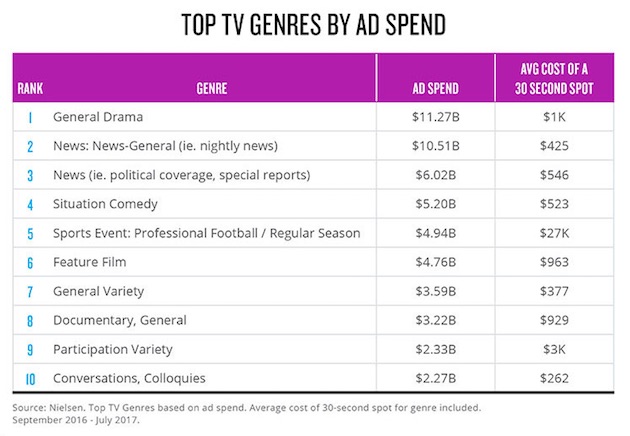
General drama programming received the most television ad spend of any genre in the 2016-2017 season: $11.27 billion.
About the research: The report was based on Nielsen data from 2013 through the first half of 2017.