Social media analytics have evolved rapidly, leaving marketers in a quandary. Digital marketers now have dozens of tools at their fingertips, such as Sprout Social, Google Analytics, Hootsuite and IBM Watson Analytics for Social Media, which provide valuable insights for customer and brand sentiment, brand awareness and share of voice.
For business-to-consumer (B2C) companies, the information (captured primarily from Twitter and Facebook) is extremely valuable in helping to define and measure advertising and messaging strategies. However, business-to-business (B2B) marketers rely on social media for demand generation as much as for brand awareness, with Twitter and LinkedIn acting as our primary channels.
Unfortunately, LinkedIn has been limited in its analytics features for organic updates, engagement, and activity.
Just recently, LinkedIn expanded its "offering for conversion rate tracking" of its sponsored (paid) updates. Although this information is critical to measure your ROI on LinkedIn ad spend, the challenge of measuring the impact and influence of LinkedIn organic activity remains
As marketers, we are responsible for content and for demand generation, so it is critical to know the impact LinkedIn has on reaching our intended target audience, driving website traffic, and determining what content, asset or campaign is resonating.
Solving LinkedIn's Organic Measurement Challenge
However, marketers don't need to manually crunch data or make assumptions regarding their overall social media organic activity. With the advent of new self-service data preparation (prep) tools, marketers can capture data in all different formats, including organic engagement information, directly from a LinkedIn Company Profile page—and combine it with other data for visual analysis.
Whether the information comes from APIs, database files, Web pages, or spreadsheets, a data prep tool allows you to bring all those formats into a single workspace, and normalize and blend the data into something you can work with and analyze.
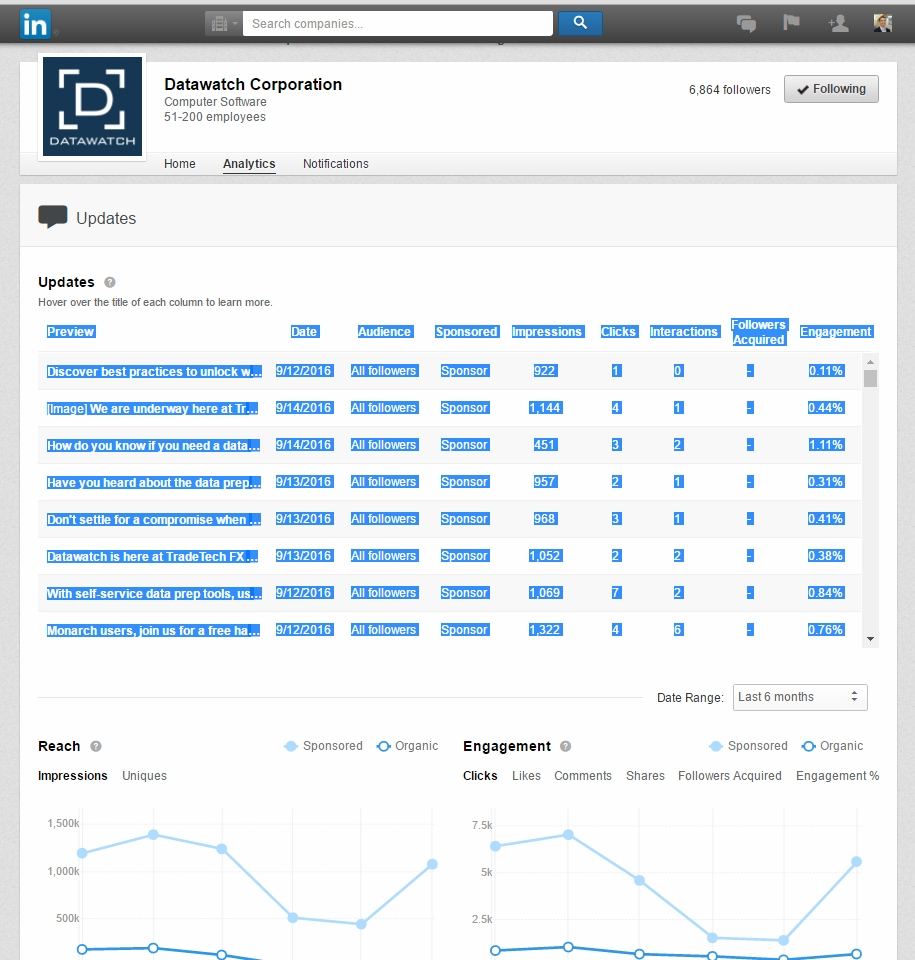
For LinkedIn analytics, there is an extra level to the challenge of accessing and combining data. As you can see in the above screenshot, a LinkedIn company profile provides several important data points:
- Updates: a listing of updates that were posted to your company profile, and a link to each post
- Date:the day each update was posted
- Impressions: the number of times each update was shown to LinkedIn members
- Clicks: a figure stating how many clicks your content, company name, or logo brought in
- Interactions: The number of times people have liked, commented on, or shared each update
- Engagement: a score based on the number of interactions, clicks, and followers acquired, divided by the number of impressions
LinkedIn also offers basic analysis of this information on the company profile page through charts and graphs showing your reach, engagement, and follower trends. However, the only place to view all that data is on your profile page; LinkedIn does not provide an API to allow for the organic data to be exported.
A data-prep solution allows you to simply select all of the update metrics within the webpage, then copy and paste right into a data prep workspace where it can be viewed in clean rows and columns. The information is then available in a workspace where it can be blended with other key datasets from, say, Twitter metrics, Google Analytics, and Salesforce.com, and then exported to a visual analytics dashboard.
Using that once-inaccessible data, marketers can make more informed business decisions and a holistic campaign assessment that allows for the following:
- Comparison of inbound website traffic data from nonpaid social media channels
- Identification of which content and campaigns are performing the best
- Detection of which channels are driving conversions to leads, opportunities, and closed deals
Self-service analytics tools helps marketers avoid the delay in waiting for the IT to run and report on the latest campaigns. Essentially, data prep allows the marketing team to work with data as effectively as data scientists.
Measuring LinkedIn's Impact: First-Hand Analytical Insight
When marketers can properly measure the impact of a marketing campaign or a new content piece on one social platform, doing so allows them to redirect efforts quickly to achieve better engagement rates.
As an example, we recently promoted a new e-book and wanted to compare its performance to previous assets, to measure whether the message was on point and to determine the most successful channel. Our analysis, conducted across several lead generation channels including Pardot emails, pay-per-click Google ads, Twitter posts, and organic engagement, determined it performed particularly well on LinkedIn. This positive result immediately inspired us to use the e-book in paid LinkedIn ads, lead generation campaigns, and other social media outlets.
Without the analytical insight, we would not have known that an expansion of marketing could result in further audience engagement.
In addition, we were able to use the comments that readers left on the postings, essentially giving us insight into what messages resonated with our customers. We used those questions as conversation starters for other posts, or we directly addressed them when promoting the e-book in other channels. With that information, we adjusted our subject lines in Pardot and Salesloft emails and saw a marked improvement in email open rates.
Understanding what our potential customers wanted to know and what caught their attention was helpful in deciding how to push that asset, and others, out in the future.
Upon further analysis, we were able to link the commenters to our website traffic and determine whether they were exploring content beyond that particular post. The result was we considered alternate calls to action (CTAs) at the end of the paper to drive more traffic. Also, we were able to reach out to commenters directly to offer a free trial, access additional assets, invite them to join related LinkedIn groups, or encourage them to become brand ambassadors.
From the in-depth analytic capability of combining LinkedIn data with information from other social platforms, our marketing team was able to optimize content across all channels. For instance, by extracting the LinkedIn data and combining it with Google Analytics reports, we had a clear picture of how LinkedIn organic updates were influencing website traffic and which organic updates were resonating by analyzing the landing pages' engagement and conversation rates. We were then able to blend that information with Salesforce.com data to see which LinkedIn campaigns were converting in the sales funnel, and we could determine the full ROI of our marketing efforts.
Now, the marketing team can optimize the use of paid LinkedIn updates for content that is proven to be high-performing, and make informed decisions when planning for future pieces of content.
Curating Data for Actionable Content Insights
Marketing continues to lead many operational functions in embracing the use of analytics. Maturing beyond single data streams into blended, curated datasets, analytics provide even deeper insights into what is working with your marketing strategy. It starts with just a single question or goal, such as what content resonated last quarter; why was the email open rate so low; or what social channel was most effective in driving traffic.
With self-service data prep tools, data-driven marketers can enrich their standard metrics with what was once unattainable data on LinkedIn organic activity, providing them with better insights and more trusted analytics to address these questions.
More Resources on LinkedIn Analytics
Six Tips for Measuring Your LinkedIn Ad Campaigns [Infographic]
LinkedIn Ads: Your Key to the Highest-Quality B2B Leads | MarketingProfs Webinar
How to Make LinkedIn Ads Work for You: A.J. Wilcox on Marketing Smarts [Podcast]