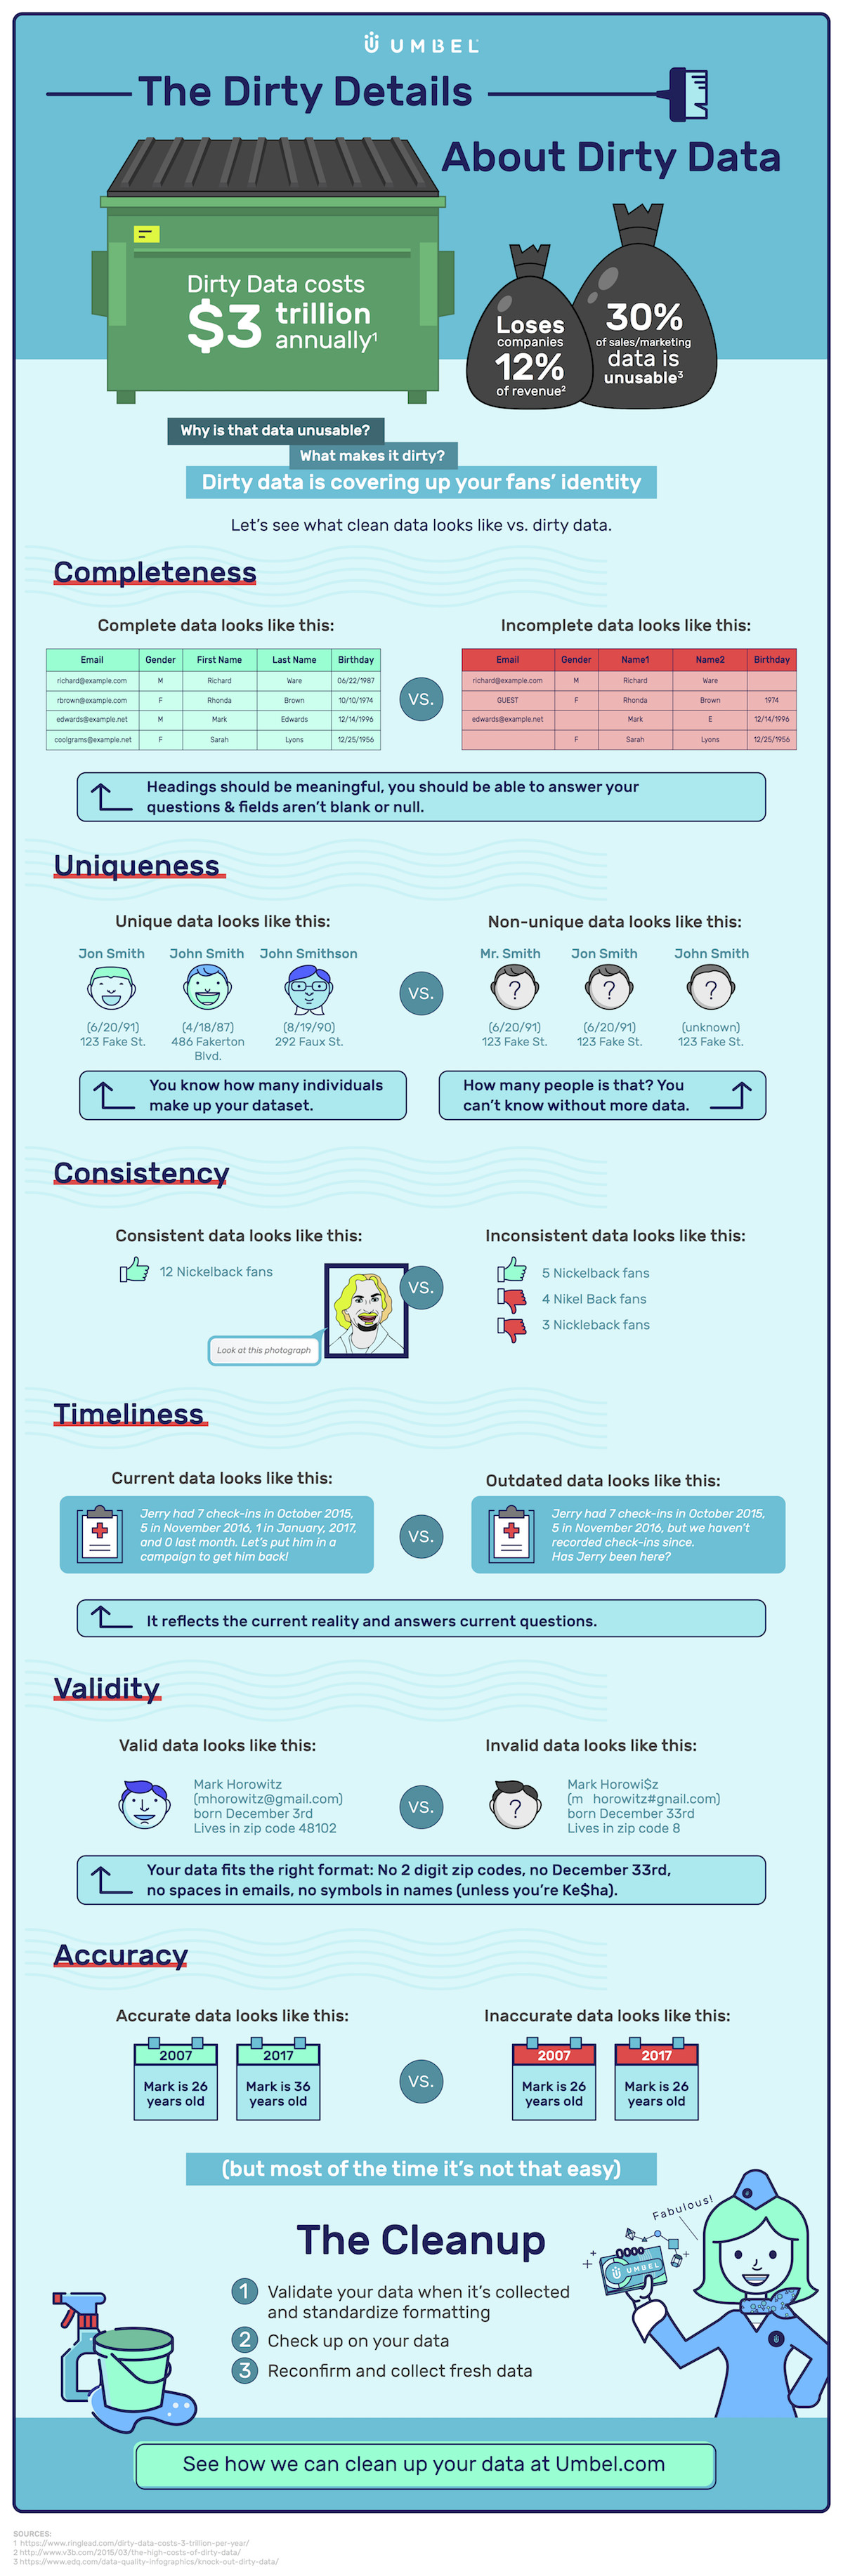
You know from the adjective that it's probably not good, but what exactly is "dirty data"?

Simply put, it's data that has errors or mistakes, or it's incomplete in some way. And 30% of marketing and sales data is totally unusable, according to an infographic released by Umbel.

Dirty data comes at a cost to companies; but, if you're not a data scientist, how do you even diagnose that you have a problem?

The infographic outlines how the less tech-savvy among us can diagnose dirty data (and avoid it) across six areas.

Get started with cleaning up your data with this infographic. Just click or tap to view a larger version:

Enter your email address to continue reading

The Nitty-Gritty of Dirty Data [Infographic]

Don't worry...it's free!

Already a member? Sign in now.

Sign in with your preferred account, below.

Did you like this article?
Know someone who would enjoy it too? Share with your friends, free of charge, no sign up required! Simply share this link, and they will get instant access…
  • Copy Link

  • Email

  • Twitter

  • Facebook

  • Pinterest

  • Linkedin


ABOUT THE AUTHOR

image of Laura Forer

Laura Forer is a freelance writer, email and content strategist, and crossword puzzle enthusiast. She's an assistant editor at MarketingProfs, where she manages infographic submissions, among other things.