It's the holy grail of social media marketing: How do you get users to share content?
A sharing strategy starts by understanding customer behavior, and an infographic by visual content creation platform Slidely explores who shares what content, and where and why they share it.
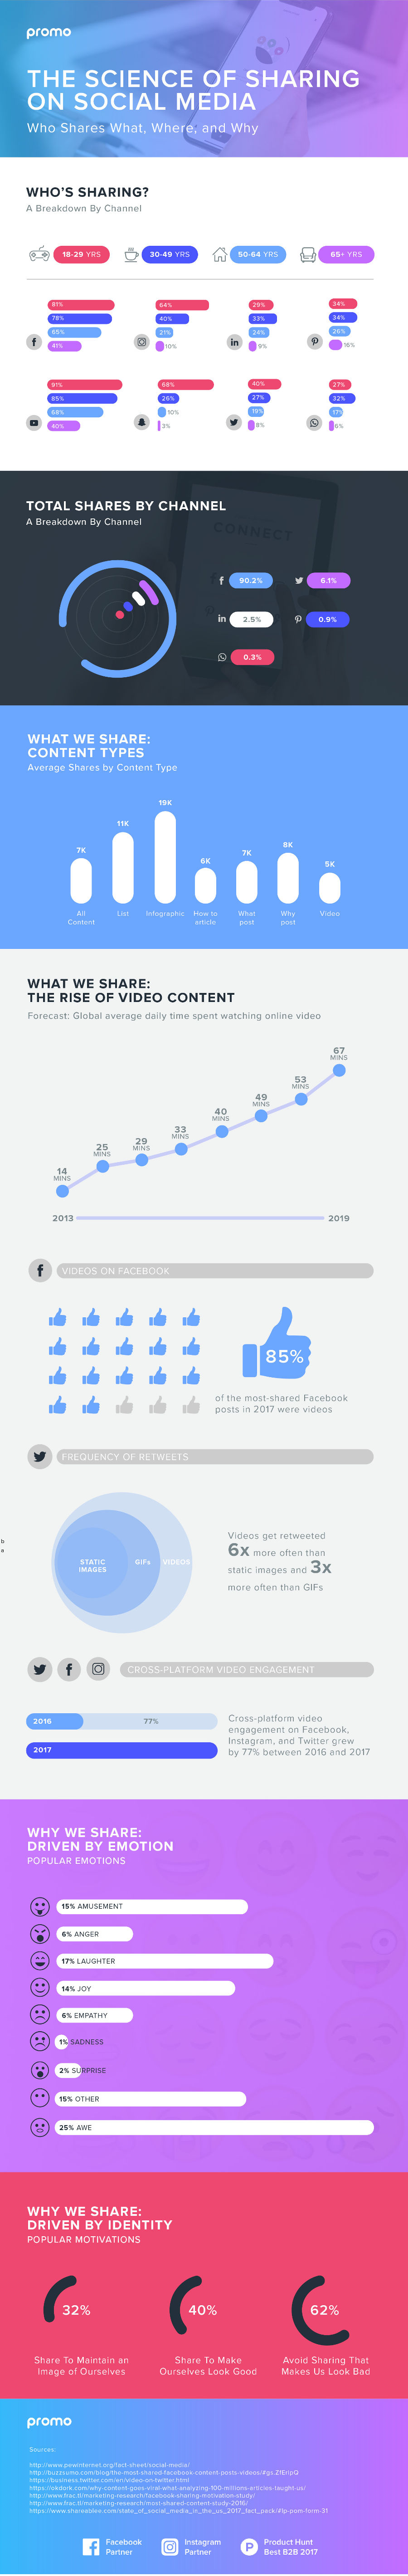
Some key takeaways from the graphic include...
Facebook is king. Despite the rise in popularity of channels like LinkedIn and Twitter, Facebook still tops the charts with over 90% of all social sharing taking place on the popular platform.
Infographics dominate. But listicles are not far behind. The number of videos shared isn't (yet) as high other types of content, but the number of videos consumed on social media in general continues to climb.
Emotions count. People share content for all sorts of reasons, such as feeling inspired, angered, amused, or even sad. Sharers like to promote a positive personal identity through shared content, which is a powerful concept to keep in mind when creating your business' social marketing strategy.
To see who is sharing what, when, and why, check out the infographic. Just tap or click to see a larger version.