The greatest insight often comes from unexpected places. We think that's true of the mixture of metrics you'll eventually select for your marketing dashboard. Here, we look at some critical metrics you may not have considered for your marketing dashboard but that may be among the most insightful and predictive you'll install.
There are quite literally hundreds of prospective dashboard metrics to consider, but only a few that will provide any leading-indicator insight. The goal here is to point out some of the places where we normally find high correlations to company profitability.
Some of these measures are often viewed as tangential to "marketing" but are, in fact, very much related to the quality and effectiveness of marketing activities. Others are frequently dismissed as "softer" measures, but are nonetheless critical to a foundation of success. Keep in mind that only you can determine which of these are right for your dashboard.
Let's begin with one of the most often overlooked areas: channel management.
Channel Metrics
If you have various distribution channels for your products, then your success is largely dependent on the strength of those channels. The right channel metrics can monitor your progress at shaping, influencing, and managing your business to ensure that the end customer is getting the best brand experience and you are getting the best return on your channel investments. Here are a few potential channel metrics to consider.
Channel Coverage
If you're selling wireless phones through independent retailers, you'll want to make sure you're covering all the places where people are buying those phones. Companies that manage their distribution chains contractually—through independent agents, sales representatives, or other partners that help them get business done—can get clarity on prospect reach and market penetration from a dashboard metric on this issue. It can be even more forward-looking if coverage incorporates prospective channel partners in various stages of finalizing agreements and building out facilities.
Channel Relationship Mix
With the level of decentralization and outsourcing in business today, companies may not have full control over the players who staff their distribution channels downstream. Major oil companies like Shell and ExxonMobil don't manage every stop on their distribution chains anymore, but they still have to keep track of how their products are selling at the consumer level. Monitoring the evolving mix of channel relationship types helps to keep the focus on the strategic importance of channel leverage strategies.
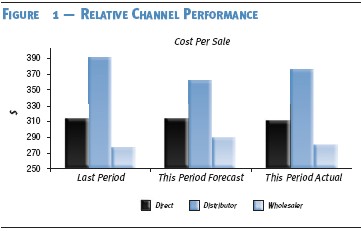
Relative Channel Performance
When you have multiple types of channels, you can often structure ways to look at marketing returns by channel—which gives you a view toward opportunities to optimize investments across channels. You might, for example, find that the cost per sale in one channel is significantly lower than the others.
This raises the question of how much more money could be spent in selling through that channel before the returns begin to diminish (an optimization challenge). Monitoring these relative channel performance measures can provoke key questions about how resources are being allocated and help forecast the need for revitalizing efforts or planning capital investments.
Channel Stock Positions
Stock-outs can be a critically limiting factor to growth. Customers get annoyed when they go out of their way to come in only to find you're out of something they think you should have. The loss can be permanent. If monitoring and forecasting in-stock and out-of-stock ratios is crucial to your business, then it's relevant for your dashboard. The forward-looking component of this measurement relies on good sales forecasting to help you spot problems with your inventory before they happen. It can also help you better manage the range of merchandise you carry and watch your inventory turns more closely.
Channel Perceptions of Marketing
There's been very little dashboard activity in this area to date, but this is a measurement category worthy of careful consideration. Many of the same companies that spend millions on research to understand customer and employee views spend nothing on capturing channel perspectives.
This is not only crucial to businesses like fast food franchisors and automobile manufacturers who must coordinate local marketing activity with regional co-ops of franchisees, but can be equally important to manufacturers of all types selling through Lowe's, Target, or other retailers for which the opinions of the category buyers and the sales floor associates can make or break marketing effectiveness. It's also important to industries that distribute through agent networks, wholesalers, or independent sales organizations.
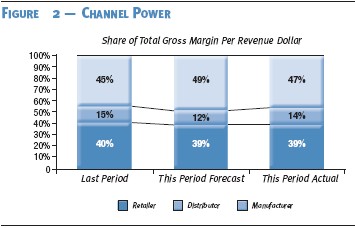
Channel Power Measures
There are a number of different ways you can measure channel power, but the most compelling is how much margin you're keeping vs. your channel partners. If the markup to the final consumer is greater than the wholesale markup, it stands to reason that you have ceded some significant power to the channel. Reclaiming some of that margin is a worthy pursuit for marketing and monitoring and forecasting channel power gives you some sense of how effective you are at changing bottom-line performance through brand building or product innovation.
Organizational Metrics
The strategy map is a tool for aligning the role of marketing with the company and clarifying the requisite business processes, information flows, and organizational skills, tools, and culture.
It seems paradoxical that the same companies that spend millions of dollars each year on training and development completely overlook marketing organizational effectiveness on their marketing dashboards. We don't hear too many arguments that the relationship between employees and customers is critical to the business, nor do we hear anyone bemoan the value of a better-skilled, more efficient workforce. So if it's really important to you that your organization is staffed with the right people with the right skills focused on the right things, you should be looking for dashboard elements to measure your progress.
But which organizational dashboard metrics tell you the most? The following are just a few examples.
Staffing Considerations
A dashboard can highlight whether you're working at full complement and deploying the available capital effectively. You might elect to reflect this as a simple percentage of approved headcount filled, or perhaps segmented on a percentage basis by newly filled vs. trained vs. highly experienced people. Or you might choose to be more forward-looking by monitoring hours worked by current staff vs. approved complement as a means of forecasting overtime costs or just highlighting potential staff burnout by correlating total hours to historical and forecast turnover or tenure rates.
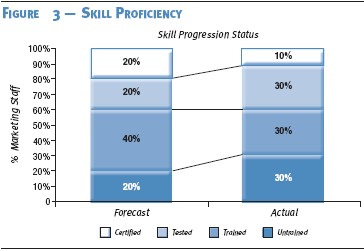
Another important dimension of staffing is skill sets. Many companies emerge from the strategy-mapping process with great clarity on the skills their department will need to hit its objectives. They then engage a training company or university to develop a curriculum to improve the specific desired skills either broadly across the marketing organization or in narrow pockets of specific expertise. Using the dashboard to monitor penetration of your target employees that have achieved the requisite or desired level of training, education, certification, or skill proficiency is mission critical and very appropriate. Skill proficiency is actually a great metric for the dashboard if you believe that training is a forerunner for success.
Succession eligibility is another great monitoring metric for the overall health of the organization. There are two ways to view succession eligibility: first, as the percentage of your senior staff who have groomed replacements ready to step in for them; second, as the overall percentage of marketing staff who are ready to step up to the next job if they had to. Either of these can be presented in stages of readiness, ranging from not-at-all to ready-to-go, which will give you a more dimensional feeling for the progress your organization is making.
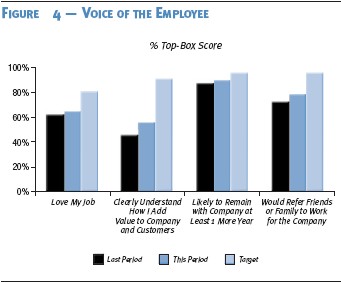
If success in your organization is directly related to employee proficiency and satisfaction, then monitoring employee feedback on your dashboard can be a terrific leading indicator. Many organizations have formal voice of the employee (VOE) programs that survey the employee population frequently on their knowledge, understanding, and enthusiasm for the company's mission and strategy. Others choose to measure overall job satisfaction as the likelihood of referring a friend or family member to buy from or work for the company in the next 90 days. These make strong dashboard metrics to the degree they can be correlated to marketplace success.
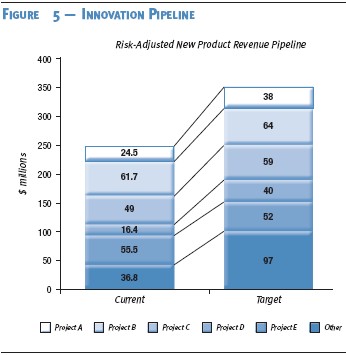
Innovation
Currently, growth is the predominant component of most CEOs' strategies. They are looking for new products, new customers, new markets, and new sources of profitable revenue. So why aren't more CMOs putting metrics for their product pipeline on a dashboard?
You can use a dashboard effectively to monitor the risk-adjusted revenue forecasts for products or services in various stages of market readiness. At a glance, this will give you terrific insight into the probability of meeting your long-term organic growth objectives. If the pipeline looks like it's stalling, you'll get an early warning indicator with sufficient time to put more resources on solving the problems or expanding the search for new opportunities.
Your dashboard is also an excellent way to track the percentage of marketing resources being spent on new product work. It helps to forecast the expected return from product development and compare it, at a glance, to the return derived from other marketing initiatives. In the end, the dashboard helps determine if innovation is being taken seriously in your organization.
Critical Project Progress
If you're building a data warehouse to transform your marketing process and strategy, you should consider monitoring that project plan on your dashboard. If you're consolidating multiple brands, sales forces, or distribution channels during a merger, then metrics that describe the stage-gates in those processes are terrific candidates to include. Whatever is important—really important—should appear on your dashboard, if you can dissect it into stages of completion, dollars, timelines, or all of the above.
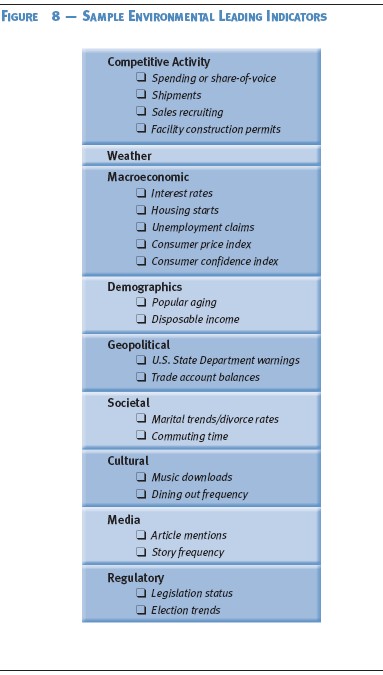
Environmental Metrics
There are many variables in the business environment that can mean the difference between success and failure. Obviously, the environmental variables affecting your business will be different from those in another industry or category. Here are a few of the more common considerations worthy of dashboard inclusion.
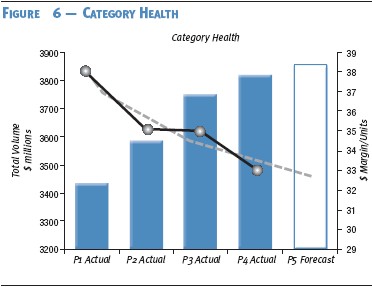
Market Growth
The health of your current markets is a critical barometer of future performance. How fast is your category growing? How many net new customers are coming into the category each day/week/month? Is the consumption pattern per customer changing for the better? Are they changing for the worse? Category health metrics like these should give you a clear sense of any rising or falling tides that may lift or crash your boat.
Competitive Health
Start tracking the margins of your competitors with every source of information you have. A dashboard is perfect for a constant reading on the ratio between how fast your products are growing and how fast your category is growing overall. It may be nice to know that the sales of a particular product of yours were growing by 8% a year, but a shock to find out that the category was growing by 12% and you were losing share all along.
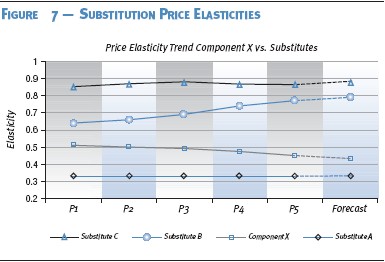
You also need to find a way to track pricing at retail (or the final sale to end users) across you and your competitors. Keeping an eye on category price elasticity can be a strong leading indicator of purchase trends and keep you in a proactive stance on margin management.
While you're at it, consider burrowing into the overall category pricing structure. This goes further than comparisons at retail to monitor how wholesale prices are moving and how raw material pricing projections might create a threat to your product pipeline and ultimately affect future costs.
Also keep an eye out for potential mergers among competitors that may decimate your channel power or shut you out of key customers.
Monitor your substitute categories of products closely to help forecast market tightening. In the chemical business, for example, there's often more than one compound that a manufacturer can use to reach a certain end result. Knowing how prices are moving in each compound class can keep you ahead of the demand curve for your own products.
You might also monitor the entry/exit barriers to your business. If the cost to enter your business starts to fall, be prepared for more competition. If it rises, better times could be ahead.
Weather
This should be self-explanatory. If weather has a big impact on your business, track weather forecasts closely. Not that we're suggesting weather is a good dashboard metric, but the long-range temperature and precipitation indices are often important elements of sales forecasts and even more often very insightful diagnostic tools.
There are dozens of companies specializing in providing detailed weather forecast data. Find the one that offers it in a form most applicable to your needs.
Trends and Demographics
Looking at the evolution of the world around you is critical. You might want to know the demographic data on who's been buying your product and whether that information is likely to undergo significant change. Changes in fashion, hairstyles, automobile engineering, family dynamics, music, and many other facets of life can have definitive impacts on businesses selling raw materials or component parts far upstream from the end consumable.
Tracing your product or service from your point of delivery through to its very end user can be extremely helpful in identifying the potentially disruptive forces at work around you and focusing attention on how to monitor them most effectively.
Macroeconomics
Consumer confidence and energy price forecasts are important to most companies, but, depending on your business, public health projections, savings rates, or interest-rate forecasts might have more relevant meaning.
Macroeconomics is one of the easiest areas to find statistical correlations to your sales or profits. Most macroeconomic factors are tracked in time series by some governmental or educational institution and the data is cheap, if not free. If you haven't done so yet, you might want to hire an academic consultant to test for some correlations for your company as a means of challenging conventional wisdom and identifying the emerging changes in your business in the larger economic context.
Start by developing a long list of hypotheses about which macroeconomic factors might be drivers of your business. Then review the list with your university consultants to see what they might add and ask them to run some correlations. Based on what they come back with, look to refine your hypotheses further, and, after a few iterations, you'll likely hone in on the best environmental leading indicators.
Geopolitics
In a world gripped by 24-hour news and volatile events at home and abroad, it never hurts to keep an eye on how economic and social events affect the spending of money. The effect September 11 had on the investment and travel industries worldwide still lingers in the minds of many marketers, not to mention their customers.
The dashboard is not an ideal place to track geopolitical events, but it can be a great way to monitor long-term shifts in political ideologies as a pre-cursor to anticipated changes in governments, consumer attitudes and behaviors, or regulatory changes. One company we know closely monitors an index of consumer "values," which it has found to be correlated to future sales of its publications. There are plenty of syndicated research services out there tracking many dimensions of these variables. If you can't find one already existing that meets your needs, consider investing in a custom approach or launching a collaborative industry effort.
Media
The advent of major media-tracking databases has made it much easier to track ideas and opinions in the world today. If your business is heavily influenced by how people think or feel about a particular issue, you can quickly establish a tracking approach to measure the number of times the issue is mentioned in the media by day, by media channel, by geographic territory, etc.
Alternatively, you can use the same services to track your own brand or industry and monitor the number of positive or negative mentions you are getting. This is especially helpful if you are intent on measuring the effectiveness of a public affairs or media relations program.
Regulation
Most businesses operate under government regulations. In fact, most operate under many government regulations. The majority of them aren't a direct concern for the marketing dashboard, but some are. For example, compliance with consumer privacy laws is a critical marketing regulatory concern. Industry pricing collaboration can also be a crucial regulatory issue.
Tracking the regulatory environment on the marketing dashboard serves two purposes. First, it keeps the organization focused on the importance of remaining in full compliance and presents the current (and forecast) levels of compliance. Second, it serves as an important support point should you ever need to demonstrate to regulators, judiciary, or the public at large just how much emphasis you put on being a good corporate citizen.
Conclusion
There are hundreds of potentially insightful marketing metrics worthy of being included on your marketing dashboard, but only a few that will give you the real insight into marketing effectiveness you're looking for. We've provided a few possible starting places to look for the areas of insight where you might not have thought to look before.
Building an effective marketing dashboard is as much an exercise in creativity and problem solving as most other marketing functions. Ultimately, the quality of your dashboard is a function of your ability to identify the hidden metrics that distinguish between success and failure. Only you will know what those are. Thinking through the list presented here should help stimulate other areas of thought.
But remember... the effectiveness of your dashboard is likely to be inversely proportional to the number of metrics you put on it. Your objective is to find the fewest number of metrics to tell the story that needs telling.