"You can't manage what you don't measure" is a saying that will never go out of style. It's timeless. In 100 years, it will still be applicable and relevant. Measurement forces us to be clear and specific and to crisply define our terms. It is the great clarifier in a world of ambiguous and imprecise language.
A new book from professors out of the Universities of Pennsylvania and Virginia is all about metrics, marketing metrics to be exact. The book is titled Marketing Metrics: 50+ Metrics Every Executive Should Master and authored by Paul W. Farris, Neil T. Bendle, Phillip E. Pfeifer, and David J. Reibstein. It is a type of cookbook with recipes for helping marketing managers or executives to design a scorecard, evaluate their business, or better assess market, competitive, and company trends.
According to the authors, the objective of the book is to take a step "toward clarifying the language, construction, and meaning of many of our important metrics." Given the drive toward making marketing more quantitative, analytical, and accountable, this book is an important work. As the authors point out, marketing is one of the least understood and least measurable functions at many companies. Frankly, marketing often doesn't get a lot of respect and is seen as "soft," especially compared with operations, sales, finance and accounting.
The book's 11 chapters consist of an introduction, nine chapters on particular metric categories, such as pricing or promotion, and a final chapter on how to conduct a marketing metrics X-ray. It is not a book you would read at one sitting or as you might a novel, but it's a great reference book for when you are thinking about metrics and what to measure.
The chapters are titled as follows:
- Introduction
- Share of Hearts, Minds, and Markets
- Margins and Profits
- Product and Portfolio Management
- Customer Profitability
- Sales Force and Channel Management
- Pricing Strategy
- Promotion
- Advertising Media and Web Metrics
- Marketing and Finance
- The Marketing Metrics X-Ray
Rather than go through all 50+ metrics, I'd like to review some of the key definitions and complications, along with some key metrics from chapters 2-10.
Defining Your Terms
Most languages, and especially business buzzwords (e.g., empowerment, alignment, synergy), are not as precise as they could be and are often open to numerous interpretations. As such, it's important to define some terms up front. The authors clarify a number of questions/terms in their introduction.
What is a metric?
The authors write that a "metric is a measuring system that quantifies a trend, dynamic or characteristic." In all disciplines, metrics encourage rigor and objectivity and facilitate understanding and collaboration.
Why do you need metrics?
The authors write that "numerical fluency" is a critical skill for every business leader today. Business metrics and measurement are essential to effectively evaluating plans, variances, and performance. Managers must be able to select, calculate, and explain key business metrics.
What about marketing metric opportunities?
It's not out of turn to say that marketing has often been regarded as more art than science. It has often been seen as a haven for the more right-brain creative types than say the "quants" out of finance or operational planning. As most of us in the business world know, there is no "easy money" in the overall budget for marketing. Marketers must know how to quantify the value of their offerings, customers, campaigns, and a host of other marketing-related activities.
The language of the boardroom is quantitative and measurement-centric. Although gut, intuition, and instinct are important traits of the executive, there still needs to be some measurement to be able to describe a situation in enough detail to use those traits.
How do you choose the right numbers?
As the authors write, the "numeric imperative" is not without its challenges. Finding a single metric "silver bullet" is not likely, and as we all know from working in companies, the data required is often estimated, incomplete, or simply unavailable.
The authors recommend that marketers use a "portfolio or dashboard" of metrics and create triangulated strategies and solutions. This recommendation is aligned with what many companies are trying to do: create real-time dashboards so they can effectively steer the business and make mid-course adjustments.
For each metric, the authors generally cover the following areas:
- Definition of the metric
- Purpose of the metric
- Data sources, complications, and cautions
- Construction of the metric
- Related metrics and concepts
Chapter 2: Share of Hearts, Minds, and Markets
The ultimate metric in this chapter is market share. Almost all marketers and executives are familiar with their market share at some level. Like most metrics, the devil is often in the details. In evaluating market share, it's important to ask the following questions:
- How do you define the competitive universe and/or market?
- What time frame are you using?
- Which units are used?
- Is the actual market growing or shrinking?
Questions addressed in this chapter include these:
- What are my market and brand penetration?
- What are prospects purchase intentions?
- What is a customer's willingness to recommend?
A metric example: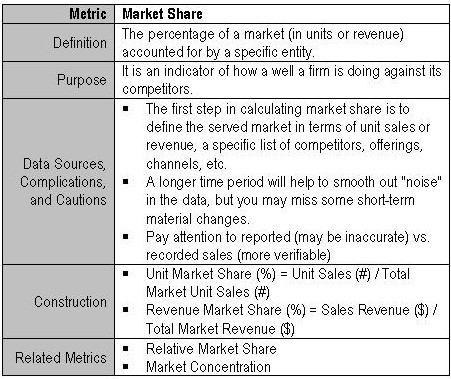
Chapter 3: Margins and Profits
As the authors write, if the purpose of a business is to create a customer, the sustainability and growth of that business is dependent on making a margin on those customers. At a high level, we know that one definition of margin is the difference between a product's price and its cost. It's not that simple, however. Margins come in many shapes and sizes with gross margins, operating margins, net margins, and various permutations of those three.
Questions addressed in this chapter include these:
- What are my channel margins?
- What are my variable and fixed costs?
- What is my breakeven sales level?
The authors also discuss "contribution margin" on sales and call it "one of the most useful marketing concepts."
Margins can be a signal for the dominance of a particular company in its industry as well as its business model (e.g., software, pharmaceuticals, etc. vs. airlines, retail, etc.). However, low margins with high turnover (e.g., asset or inventory turns) are a model that can drive significant revenue, as illustrated by Wal-Mart and Home Depot.
A metric example: 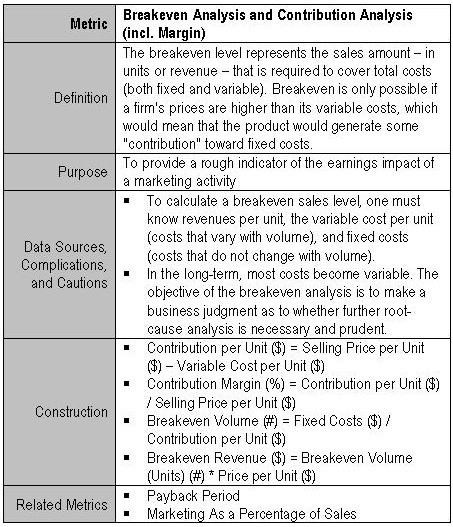
Chapter 4: Product and Portfolio Management
This chapter is all about understanding how a product or service fits customers' needs. The authors describe numerous metrics used in product strategy and planning.
Questions addressed in this chapter include these:
- What volumes can marketers expect from a new product?
- Is brand equity increasing or decreasing?
- What are customers willing to sacrifice to obtain what they want?
Companies that emphasize a new product and/or portfolio mix may be looking for increased margins (e.g., sell more margin-rich offerings), competitive advantage (e.g., different solution mix than competitors), or which offerings are feasible to launch.
A metric example: 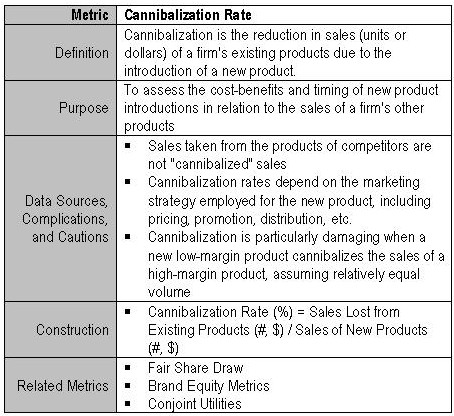
Chapter 5: Customer Profitability
In this chapter, the authors cover metrics that measure the performance of individual customer relationships. Think of the various options around customer lifetime value metrics, along with the numerous inputs. The authors also outline metrics around acquiring new customers, as well as those to measure the retention and profit from existing customers.
Questions addressed in this chapter include these:
- What is the average acquisition cost for a new customer?
- What is the average cost to retain a current customer?
- What is a prospects lifetime value?
A metric example: 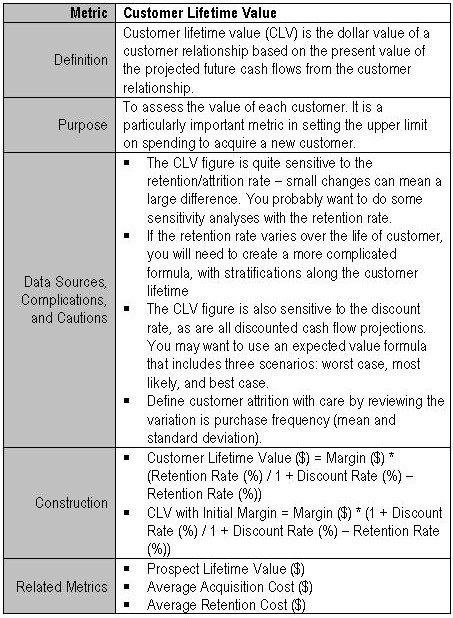
Chapter 6: Sales Force and Channel Management
The first section of this chapter discusses sales force metrics, including pipelines, forecasts, and conversion rates. In latter sections of the chapter, the authors discuss metrics around product distribution and availability.
Given that many marketers want to demonstrate how they can drive a larger pipeline and increase win/close rates, sales force metrics are important downstream metrics for the marketer. Every company closely monitors sales or revenue. Being "close" to revenue (e.g., sometimes referred to as "revenue distance") is a good place for marketers to be.
Questions addressed in this chapter include these:
- How effective is the sales force?
- What is the size of the sales pipeline?
- What is the value of the inventory and what's out-of-stock?
- What is the gross margin return on inventory investment?
A metric example: 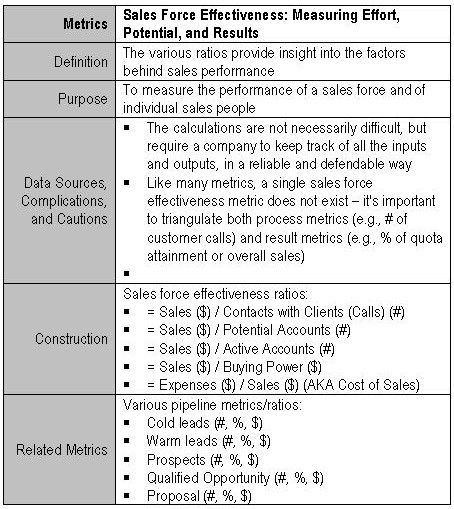
Chapter 7: Pricing Strategy
In general, there aren't many topics that are more important than pricing. Many companies "leave money on the table" by mis-pricing their offerings. Sales or revenue is often dependent on three variables, one of which is average sales price, with the other two being volume and mix of offerings sold.
A significant part of this chapter discusses price elasticity or the way a price adjusts given supply or demand changes. As anyone who has read a few books on pricing or built models around it, pricing strategies can be quite in-depth, complicated, and somewhat statistical in terms of linear functions and extrapolations.
Questions addressed in this chapter include:
- What is a customer's reservation price?
- What is the price elasticity of demand?
- What is the optimal price of the product or service?
- What is the price premium vs. a benchmark?
A metric example: 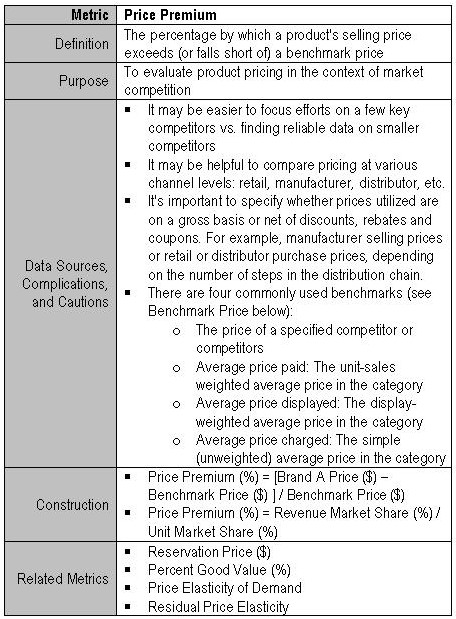
Chapter 8: Promotion
The authors write that price promotions can be divided into two broad categories:
- Temporary price reductions
- Permanent features of the pricing systems
Both promotion strategies seek to change the behavior of buyers in ways that increase sales and profits over time, although the short-term effect on profits will often be negative. Most marketers are familiar with various promotional objectives, such as the following:
- To acquire new customers by giving them a trial of an offering (e.g., 30-day free trial, free up-front assessment, etc.)
- To attract new segments that are more price sensitive than the firm's traditional customers
- To increase the purchase rate of existing customers
- To smooth out production or demand
- To increase shelf space
The authors recommend "partitioning" sales into baseline and incremental sales. Basically, you want to isolate the "delta" between baseline sales and the incremental sales that the promotion generated (the "lift"). As most of us know from shopping in department stores, the long-term effects of promotions can reinforce your customers to only buy when there's some sort of promotion. They should be used with care and precision.
Questions addressed in this chapter include these:
- What is the baseline (vs. incremental) sales level?
- What is the promotional lift in sales?
- What are the percentage sales with a promotion vehicle?
- What does the price waterfall look like?
A metric example: 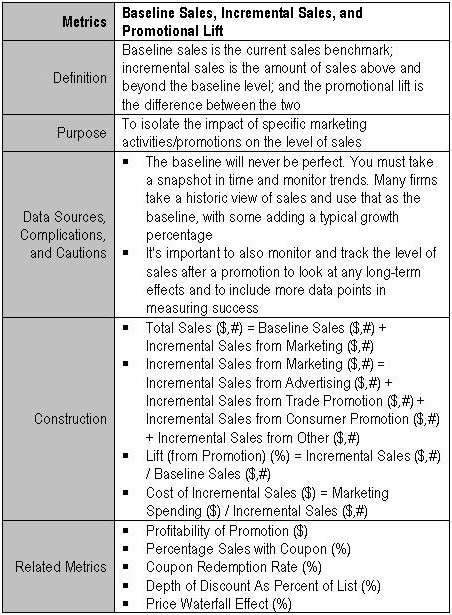
Chapter 9: Advertising Media and Web Metrics
As the authors write, advertising "is the cornerstone of many marketing strategies." It is often a key element of the marketing mix, but as the authors point out, it is also "expensive and notoriously difficult to evaluate." Advertising can often be a "blunt" instrument to use in driving overall sales (in the current period), especially when branding or trying to drive awareness.
In the first part of the chapter, the authors discuss and introduce the vocabulary of advertising metrics, including such terms as impressions, exposures, OTS (opportunity to see), rating points, GRPs (gross rating points), and CPMs (cost per thousand impressions), among other terms.
In the second part of the chapter, the authors focus on metrics used in Web-based marketing efforts, which have become more and more common. The Internet is a key tool to augment traditional broadcast advertising. Web metrics discussed include pageviews, clickthrough rate, cost per click, and visits, among others.
Questions addressed in this chapter include these:
- What are the gross rating points?
- What is the cost per thousand impressions?
- What is our net reach?
- What is the cost per click and order?
A metric example: 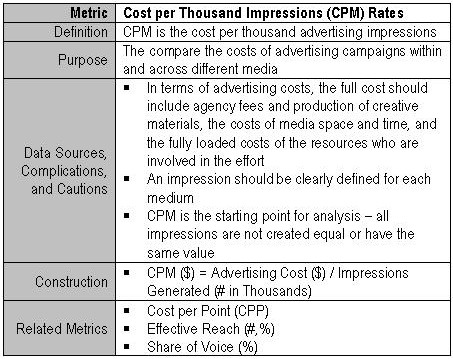
Chapter 10: Marketing and Finance
Ultimately, if marketing wants more money out of the budget it needs to show a good return of some sort. As the authors point out, almost all business activity requires some cash out-flow. In general, finance and the business want to invest money in areas where they can get a good return on their investment. If there are two equal choices, and one returns 10% while the other returns 20%, the choice is relatively simple, assuming equal timing, risk, cost of capital, and strategic value, among other factors.
The authors discuss some typical finance metrics that most marketers should know, if they don't already. Metrics such as return on sales (ROS; AKA, net margin percentage), return on investment (ROI), economic value added (EVA), net present value (NPV), and internal rate of return (IRR). The authors also dissect the more recent return on marketing investment (ROMI) metric, which is less consistent in application and use than some of the more typical measures.
Questions addressed in this chapter include these:
- What is the return on sales?
- What is the return on investment?
- What is the economic profit?
- What is the return on marketing investment?
A metric example: 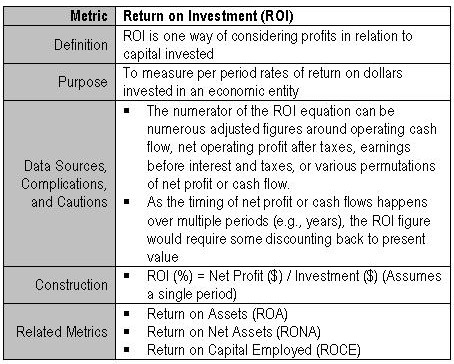
Chapter 11: Marketing Metrics X-Ray
In the final chapter, the authors want you to apply the lessons and recommendations about using metrics to really "see" what's going on in a firm. In their first example, the authors want you to imagine that you need to advise one of your grandparents regarding one of two firms to invest in with their limited retirement savings. The authors provide you with some financial figures and some marketing metrics.
A subset (more is in the book) of the firm's financial statements is presented below.
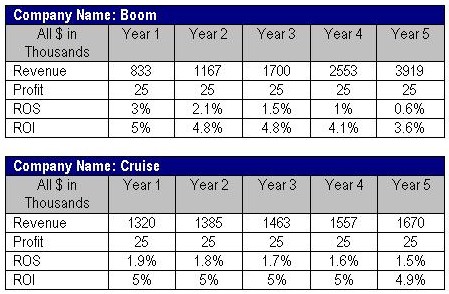
If all you review is the financials, you might choose the company named Cruise. It would seem that they have a stable ROI and, probably, cash flows. The revenue has not grown as fast as Boom's, however, so you'd probably need to know more (assuming you had access to the data below).
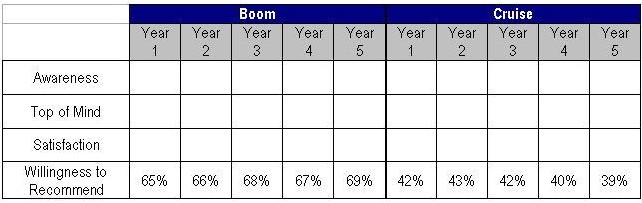
A subset of the marketing metrics presented for Boom and Cruise include:
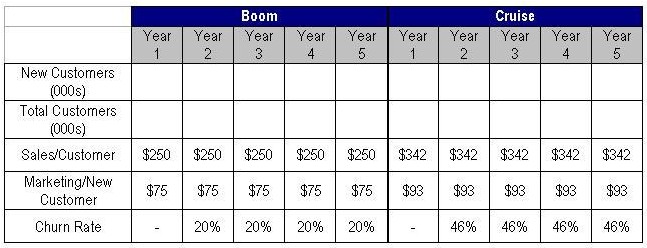
Click to enlarge
Click to enlarge
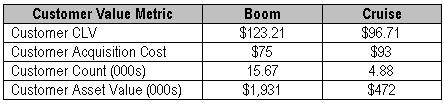
I haven't filled all of the data in for the two companies (wanted to at least share the pro forma matrices, which I think are quite valuable), but it begins to become relatively clear that Boom is adding more value and has a better return on customer and larger customer list than Cruise. Boom also has a customer set that is more willing to recommend the company to others.
In reality, many companies would be hard pressed to produce reliable data for the matrices above. For a large company, it would have to be "sliced and diced" in numerous ways to get a true picture of the underlying dynamics. The authors present another example to give you more experience in triangulating and comparing metrics across time, categories, and firms.
In the last few pages, the authors present their perspective on marketing dashboards. The authors write (with an automobile in mind) that a "dashboard is to provide a reduced set of vital measure in a form that is easy for the operator to interpret and use." A dashboard would be different depending on industry, audience, and purpose; but, overall, they are quite cogent in highlighting trends, patterns, and issues.
In their final summary the authors present an equation that really sums up the book:
Marketing Metrics + Financial Metrics = Deeper Insight
Per the example of X-rays presented, the authors illustrate how understanding a select group of marketing metrics can give deeper insights into the financial future of companies. It is "important that a full array of marketing and financial metrics inform" decisions. A complete set of X-rays doesn't necessarily make the decision any easier, as the data could be quite mixed, but it does help to ensure a more comprehensive and data-driven diagnosis. As they say, diagnose before you prescribe.