Post-click marketing at its most basic is a conversion path rather than a single landing page. People who respond to your ad land on a path. As they move along this path, they make choices that give you information. Here’s an example: You advertise a health-care solution to hospitals. On the first page of the path, the respondent must choose between “Solutions for Large Hospitals” and “Solutions for Small Hospitals.” When the respondent makes this choice, he “segments” into one of these categories. Your post-click results should show you how many small hospitals are converting, how many large hospitals are converting, and how many of each are abandoning.
Take things a step further. Instead of putting up one path, you might test two or three paths at one time. Let’s say you’d like to test the effectiveness of a certain graphic look and feel. Or the effectiveness of using more text as opposed to less. You do this by putting up more than one path. A person who clicks on your ad lands on one of these paths, assigned at random. The results tell you which path is converting the most respondents.
A good post-click marketing deployment should also allow you to collect data on traffic sources. So, say your traffic comes from ads you’ve posted on Google and Yahoo! You can see the data on conversions by traffic source, and know where to optimize your buy.
Putting it All Together: The RTP Matrix
Viewing the performance of respondent segments, traffic sources and paths each on their own is helpful. But the potential for real breakthrough post-click marketing intelligence is at the intersection of these three forces. The company ion interactive calls this the RTP matrix for Respondents, Traffic sources and Paths.
RTP matrix testing addresses the ultimate question: Which respondent segments, arriving from which traffic sources, are converted most effectively by which paths? Once you uncover that answer, you can optimize your entire online direct marketing chain, not just its individual components.
We call this matrix testing because it compares every segment in every traffic source against every path, in a three-dimensional matrix. If you’re familiar with Excel, this is similar to a pivot table; in data mining applications, it’s often referred to as a cube. Success is measured according to a combination of three metrics:
• The conversion rate, as a percentage of the total traffic;
• The actual number of converted respondents;
• The average qualifying score of converted respondents.
When reviewing the RTP matrix in all three dimensions, you’re able to identify hot spots of activity at a high level that are performing particularly well. From there, you can zoom in on more detailed comparisons to better understand the specific reasons for their unusual performance.
The following table demonstrates one possible RTP matrix view that identifies three hot spots. Two path/traffic source combinations are excelling on specific audience segments, and one path/traffic source combination is decidedly sub-par:
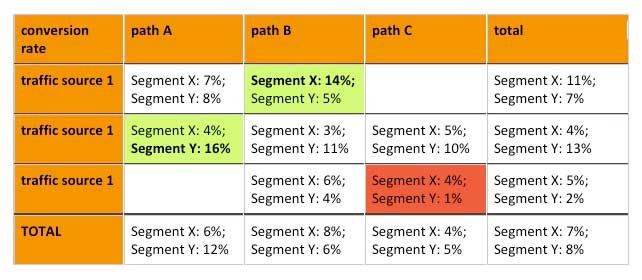
This detailed cross-analysis gives you crucial revelations. For instance, Path A paired with Traffic Source 2 may only be delivering an 8 percent conversion rate overall-which hardly distinguishes it from most of the other path/traffic source combinations. Here, however, you are able to hone in on the discovery that for Segment Y, this particular combination is a real winner.
For different perspectives, ion interactive also examines two-dimensional grids that are sliced out of the full three-dimensional RTP matrix:
- RxT (Respondents x Traffic Sources) Grid: which traffic sources are drawing in which audiences; where are your different respondent segments coming from?
- RxP (Respondents x Paths) Grid: which paths are resonating most effectively with your different target audiences; what is the best way to present your message to convert different respondent segments?
- TxP (Traffic Sources x Paths) Grid: what is the best combination of click marketing and post-click marketing?
Post-Click Perfection
RTP matrix testing can answer almost any reasonable question about post-click marketing performance. ion interactive captures the most common RTP matrix analyses in simple reports so that once you have identified which results are most relevant to you, they’re quick and easy to reference.
The insights you gain from RTP matrix testing give you tremendous power in the strategic design and tactical deployment of your post-click marketing efforts. You’ll maximize your return on traffic sources, identify shifts in opportunities and act on them more quickly.


