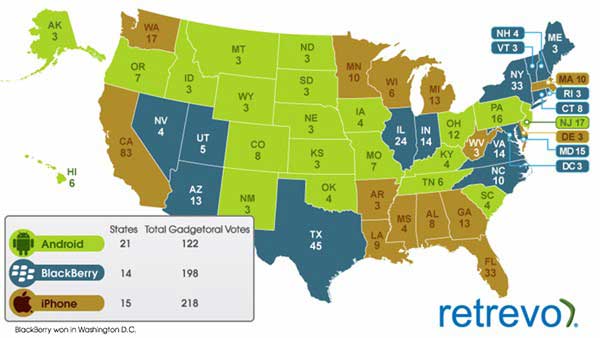
The "gadgetoral" votes are in: The great state of California has the highest per capita ownership of iPhones in the US—casting 83 gadgetoral votes in favor of the device—whereas New Jersey has the highest ownership of Androids, according to a survey from Retrevo.
Using a voting system similar to the Electoral College, nation-wide results were tabulated based on smartphone ownership per capita among individual states.* Across the US, the iPhone edged out the BlackBerry in gadgetoral votes (218 to 198). Android ranked third with 122 votes, but grabbed the highest number of states (21), compared with the iPhone (15) and the BlackBerry (14).
Below, other findings from The 2010 Retrevo Gadget Census, which explores smartphone ownership trends across the US.
Looking for great digital marketing data? MarketingProfs reviewed hundreds of research sources to create our most recent Digital Marketing Factbook (May 2010), a 296-page compilation of data and 254 charts, covering email marketing, social media, search engine marketing, e-commerce, and mobile marketing. Also check out The State of Social Media Marketing, a 240-page original research report from MarketingProfs.
iPhone States
California and Massachusetts (casting 10 votes) ranked highest in per-capita iPhone ownership. Florida was also firmly in the iPhone camp—casting 33 votes in favor of the device.
BlackBerry States
A staple for corporate America on the move, New York (casting 33 votes), Texas (45), and the Beltway states of Maryland (15), Virginia (14), and the District of Columbia (3) came out for the BlackBerry.
Android States
The Android captured the highest number of states in the gadgetoral election. However, aside from New Jersey (17) and Pennsylvania (16), most of the Android states, such as Hawaii (6) and Montana (3), were among those with small populations. As such, Android didn't garner a lot of gadgetoral votes.
*Each state was granted a 3-vote minimum consistent with the Electoral College. Phone "states" were created based on differences in per capita ownership between individual states and the national average.
About the data: Findings are from Retrevo's 2010 Gadget Census, conducted online from March to July 2010 among 7,500 consumers, evenly distributed across gender, age, income, and location in the US.


