Small SaaS (software-as-a-service) companies tend to relentlessly experiment with Web-page designs to improve results. That best-practice (often in the form of A/B testing) is seeping into other online industries.
However, few modern marketers know that A/B testing is inspired by the work of early marketers, such as Claude C. Hopkins (author of Scientific Advertising) and Lester Wundermann (godfather of direct marketing).
Hopkins and Wundermann cut their teeth on writing copy that sells, and they were never satisfied until they could trace the ROI of every single ad variation. Sometimes, that meant painstakingly tracking the performance of over a thousand ads (and they did that long before Excel was invented).
Since then, many people have written about A/B testing, but as an insider I know that they're only revealing part of the picture. The process extends far beyond pitting one design against another. In only doing that, the following critical answers often lie unanswered:
- What should I test?
- How do I calculate statistical significance?
- How do I know if A/B tests are really having an impact on revenue?
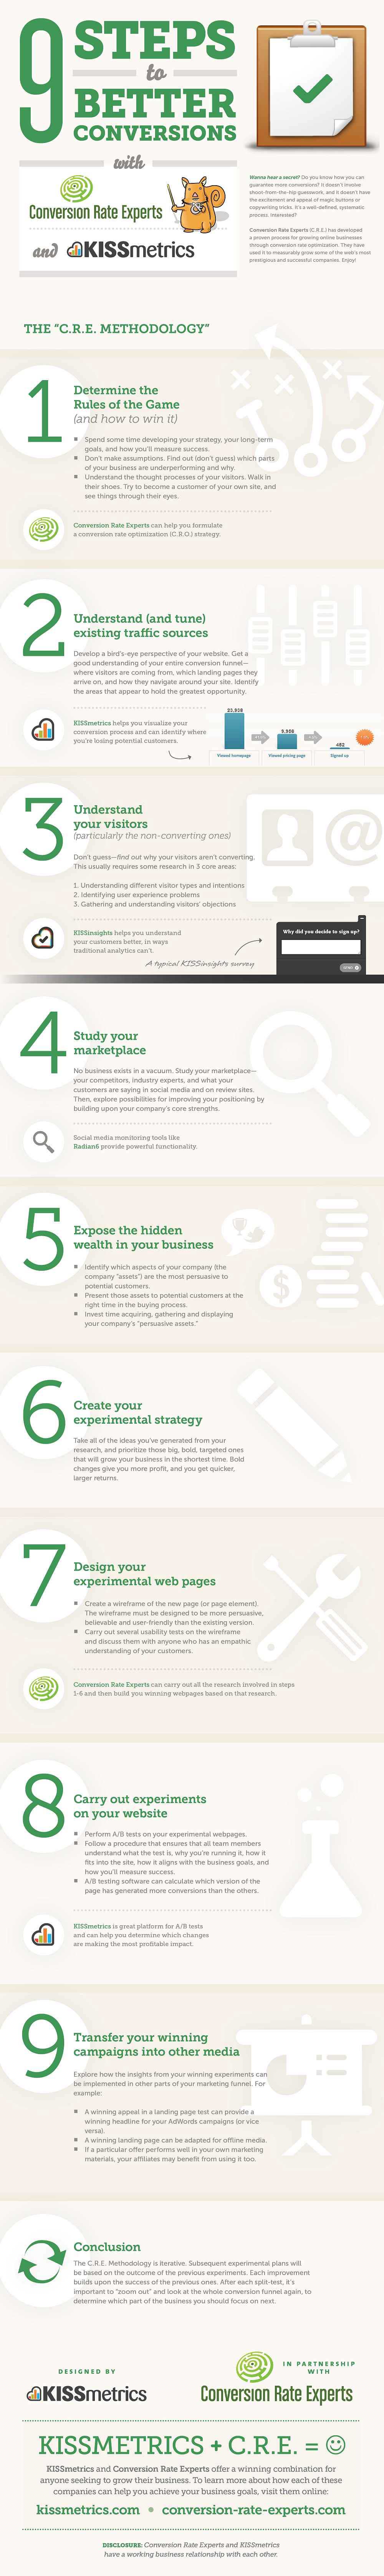
Over time, insiders in the analytics industry have codified A/B-testing to help clients understand how it all really works. The following infographic by KISSmetrics and Conversion Rate Experts highlights one approach that works particularly well for SaaS businesses and can be applied in other industries.