Total measured advertising expenditures fell 12.3% in 2009 from 2008 levels, to $125.3 billion, according to data released by Kantar Media (formerly TNS Media Intelligence).
Ad spending during the fourth quarter of 2009 was down 6.0% compared with the same period a year earlier, with nearly all media improving compared with the previous nine months.
"The advertising recession began to ease in the final two months of 2009; and preliminary figures from the first quarter of 2010, when compared against the abyss of a year ago, indicate many sectors are experiencing growth," said Jon Swallen, SVP of research at Kantar Media.
"Given the restraint in consumer spending, it appears marketers have more confidence right now than their customers. As we get deeper into 2010, the pace of consumer activity will be a key determinant of the strength and durability of the advertising recovery."
Below, measured ad expenditure-related data and analysis from Kantar Media.
Ad Spending by Medium
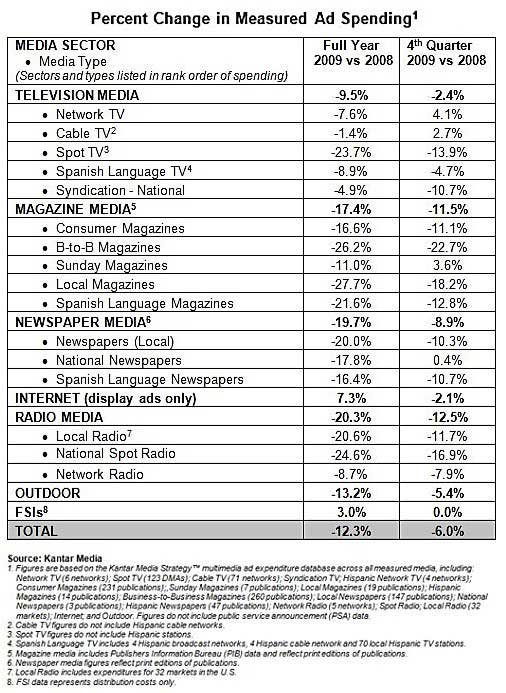
- Internet display advertising increased 7.3% in 2009, aided sharply by higher spending from the telecom, factory auto, and travel categories. The only other media type to achieve full-year growth was freestanding inserts (FSIs), up 3.0%, as CPG marketers targeted value-conscious shoppers with couponing programs.
- Print media were hit by large reductions across a broad range of advertisers: Measured ad spending in the Newspaper sector plunged 19.7% in 2009, while Sunday Magazine expenditures declined 11.0% and Consumer Magazines fell 16.6% percent for the year.
- Among television media, ad spending on cable TV dropped just 1.4%, helped by an expanding amount of commercial time. Network TV and Spanish Language TV both declined for the year (7.6% and 8.9%, respectively), but both registered yearend improvement in key categories that lifted their annual results. By contrast, Spot TV lagged far behind , down 23.7% from 2008, a period bolstered by record amounts of political advertising.
- Total spending in radio media was down 20.3% for the year.
Ad Spending by Advertiser
The top 10 advertisers of 2009 spent a combined $16,556.1 million, down 0.9% from 2008. Across the Top 50 companies—a more diversified group of marketers representing almost one-third of the measured-ad economy—spending fell 5.1%, to $42,401.3 million.
At the other end of the spectrum, small advertisers—those ranked outside the Top 1,000—trimmed their collective budgets by 20.3%.
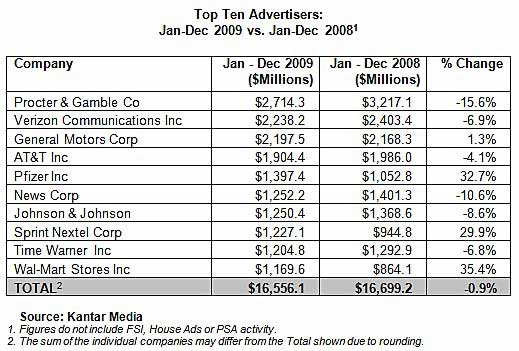
Among the top 10 advertisers:
- Procter & Gamble edged out Verizon Communications to claim the top spot in the rankings: The CPG giant spent $2,714.3 million, up 15.6% from last year.
- Three of the top advertisers posted healthy double-digit gains: Wal-Mart increased its budget by 35.4% behind the launch of its "Save Money, Live Better" campaign. Pfizer spending rose 32.7% as the company boosted marketing support for Lipitor ahead of the brand's 2011 patent expiration. Sprint Nextel, battling for market share against its larger wireless rivals, increased its spending by 29.9%.
- General Motors, despite a 30% drop in vehicles sold, spent 1.3% more on media advertising and was the only auto company in the Top 10 rankings.
Looking for great digital marketing data? MarketingProfs reviewed more than 200 research sources and selected 64 of the best to create the Digital Marketing Factbook a 144-page compilation of data and 110 charts, covering email marketing, search engine marketing, and social media. Also check out The State of Social Media Marketing, a 240-page original research report from MarketingProfs.
Ad Spending by Category
Expenditures among the 10 largest advertising categories totaled $70,739.4 million, down 10.7% from the $79,228.0 reported in 2008.
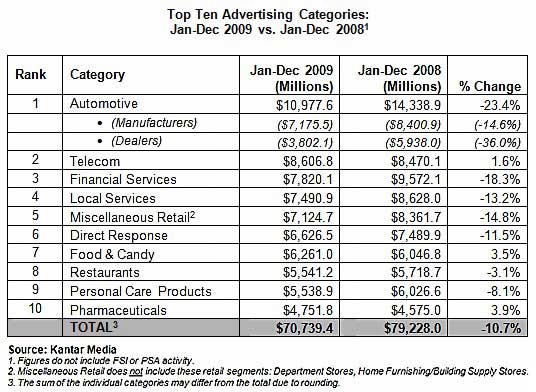
- Despite spending cuts of 23.4% from the previous year, Automotive maintained its top-category rank with total spending of $10,977.6 million. Fourth-quarter figures were markedly brighter, off just 0.9% from the same period a year earlier. Dealers continued to cut budgets more severely than manufacturers in the face of withering sales. As of the fourth quarter, auto category spending had declined for 18 consecutive quarters.
- Telecom was the second-largest category, with $8,606.8 million of measured expenditures, a gain of 1.6%. Results were driven by the fierce competition among wireless carriers and TV service providers.
- Food & Candy was up 3.5%, to $6,261.0 million, as many leading marketers took advantage of lower ad prices and strategically increased support for key brands.
- Pharmaceutical expenditures rose 3.9%, to $4,751.8 million, on the strength of well-funded marketing launches for several newly approved prescription drugs.
Branded Entertainment
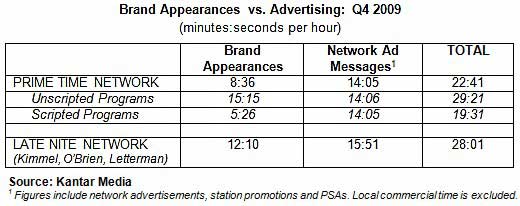
In the fourth quarter of 2009, an average hour of monitored prime time network programming contained 8 minutes, 36 seconds (8:36) of in-show brand appearances and 14:05 of network commercial messages. The combined total of 22:41 of marketing content constitutes 38% of a prime-time hour.
Other findings:
- Unscripted reality programming had an average of 15:15 per hour of brand appearances, compared with just 5:26 per hour for scripted programs such as sitcoms and dramas.
- Late-night network talk shows averaged 12:10 per hour of brand appearances. The combined load of brand appearances and network ad messages in those late night shows was 28:01 per hour, or 47% of total content time.
- The top 5 ranked by number of brand appearances were Yamaha Music Equipment, 24 Hour Fitness Center, Dell, Ford, and Bud Light.
Note: Kantar Media monitors branded entertainment within network prime time and late night programming. The tracking identifies brand appearances and measures their duration and attributes. Given the short length of many brand appearances, duration is a more relevant metric than a count of occurrences for quantifying and comparing the gross amount of brand activity that viewers are potentially exposed to in the program versus the commercial breaks.
About the data: Kantar Media tracks all media (print, radio, TV, internet, social media, and outdoors worldwide) for a full range of media insights and audience measurement.


