Marketers talk about asking for feedback all the time. Yet, few marketers take the time to really engage with subscribers on any level. That's why Betty Crocker (www.bettycrocker.com) stands out by adding a rating score to the footer of its email template (see below). Subscribers can rate each message from "Not useful" to "Very useful," on a one-to-five scale.
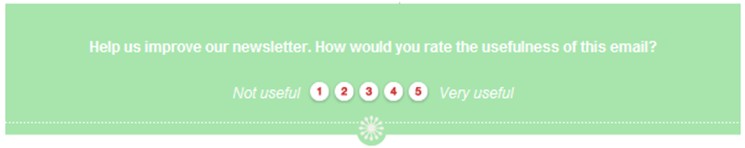
This is smart and pretty brave—but it's also nearly invisible. Perhaps Betty Crocker is testing the feature before making it more accessible.
For starters, it should be more prominent in the message and easier to read. White copy on the light green background does not pop. Also, all rating choices go to the same landing page (image below), which articulates what I believe is genuine gratitude—but misses a big opportunity to engage further.
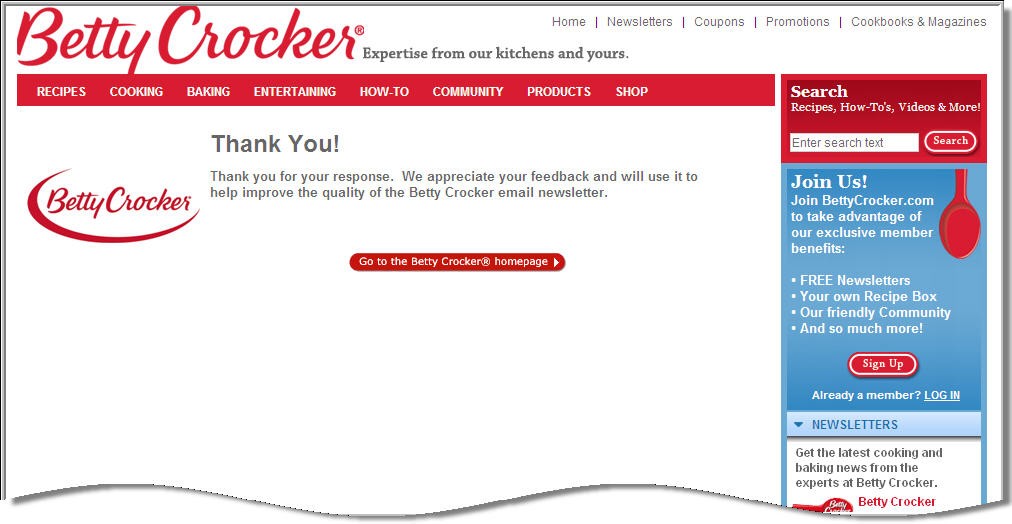
For example, it would be great to see the compiled votes of others, and to have a chance to also provide comments. The landing page is also a great place to link to the Preference Center or some other recent email messages with interesting recipes or tips.
In short, Betty Crocker starts the conversation but then cuts the subscriber off.
One of the things we love about email marketing is the plethora of data it can generate. Of course, piles of data are also harder to synthesize and manage. Email marketers get lots of subscriber feedback: opens, clicks, conversions, complaints, inbox-delivery rate, unsubscribe requests, and pass-alongs (forwards).
Unfortunately, most of that data gets aggregated and averaged out into a bland pulp, which makes it hard to really take the pulse of our subscribers. Averages are the curse of insight. Averages don't tell me if subscribers are engaged by content even though they don't click, or if they think less of our brand because they didn't like our subject line or image choice this month.
The rating-score program could get closer to teasing out such insights, but doesn't.
A better way to look at data is at the subscriber level. Comparing response metrics with complaints can be very instructive. At what point do active subscribers just get sick of hearing from us? That's a frequency and cadence challenge. Also, trending data across a few months or year-over-year can reveal interesting subscriber behaviors. For example:
- Seasonal impact: Fewer messages may be welcome in August than November.
- Acquisition value: One data source or promotion may drive more active subscribers than another.
- Complaint habits: ISP complaints (subscribers clicking on the Report Spam button, which can depress inbox deliverability) may rise at the end of a month or quarter, or be more sustained during times when there are high numbers of new subscribers on the file.
- Brand-community voice: Are there spikes in clicks, forwards, or complaints during peak periods of social activity on your site/blog? Does your data show that email can sustain a social outreach program or benefit from a period of high product review submissions?
So too with Betty Crocker's rating data. Since the rating-form location in the footer means that the only people rating Betty Crocker messages are those who made it to the bottom of the long newsletter, tracking this by subscriber activity might reveal that plenty of subscribers are reading or skimming, even if they don't download images (and register an open) or click. So no response data might actually be a fine thing. Is skimming with no click an acceptable behavior for reaching the Betty Crocker email marketing goals? If not, test the format, frequency/content mix, and design template to encourage a different type of interactivity.
Having data and learning from data are totally different things. Here are three tips for asking for and using feedback:
- Go all in. If you ask, do it courageously and prominently. Be sure to use it and celebrate the information you received. Let subscribers know what you did with the data they provided, and thank them.
- Measure at the subscriber level, over time. Be sure your business goals are aligned with the impact of your email program. Instead of just tracking campaign levels, make sure to trend data over the month or quarter to see how segments of subscribers behave and measure the impact of email on other behavior (like website session length, average order size, frequency of purchase, etc.)
- Use quantitative data to understand qualitative data. If Betty Crocker allowed comments on the landing page after I rated their email, I might tell them that I like their recipes but have trouble finding the ingredients. This is an issue that can then be raised with the chefs. Without that insight, the rating data alone would suggest only a problem with the email program itself.