US advertisers are expected to spend nearly $77 billion on interactive marketing by 2016—as much as they now spend on TV—according to a new report by Forrester Research.
By 2016, search, display, mobile, email, and social media together are expected to constitute 26% of all ad spending, up from 16% in 2011.*
The new forecast also anticipates declines in group-buying offers, due in large part to increased clutter in the space as ad exposures grow.
"We expect this [interactive] growth to help firms become adaptive, kill off daily deals, re-emphasize marketing's four Ps, (product, price, place, and promotion), and turn consumer electronics into audience-targeting tools," said Forrester analyst and report author Shar VanBoskirk.
Below, additional projections issued by Forrester Research.
Among the top interactive marketing categories, ranked by forecast share of 2016 ad spend:
- Search will continue to dominate spending, growing from $18.8 billion in 2011, to $33.3 billion in 2016. At an estimated 12% CAGR (compounded annual growth rate), search will lose share, from 55% of interactive spending in 2011, to 44% 2016, as marketers refocus their search marketing strategies on "getting found" by users via any medium—not just search engines.
- Investments in display advertising such as contextual listings, static image ads and rich media ads (including pre-roll, mid-roll, and post-roll online video) are forecast to reach $27.6 billion by 2016, growing at a 20% CAGR and reaching 36% of interactive spending over the next five years.
- Mobile ad spending is projected to surpass email and social spending, reaching $8.2 billion in 2016 at a 38% CAGR. That spending will likely be driven by more relevant mobile advertising, increased tablet adoption, and mobile commerce, according to Forrester.
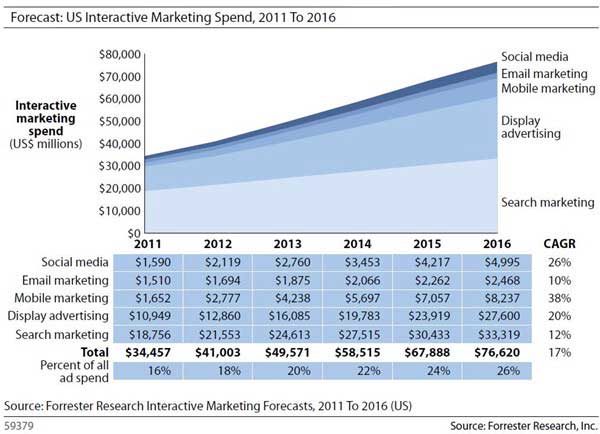
In the social category, the combination of social media management technologies, agency fees, and spending on paid integrated social network campaigns will drive social media at a 26% CAGR over the next five years, reaching nearly $5.0 billion and accounting for just 7% of all interactive spending by 2016.
Email marketing is expected to total $2.4 billion by 2016 at a 10% CAGR over the next five years.
Looking for great digital marketing data? MarketingProfs reviewed hundreds of research sources to create our most recent Digital Marketing Factbook (May 2010), a 296-page compilation of data and 254 charts, covering email marketing, social media, search engine marketing, e-commerce, and mobile marketing. Also check out The State of Social Media Marketing, a 240-page original research report from MarketingProfs.
*Originally, the interactive portion of total spending was published at 35% (vs. 19% in 2011), but Forrester later revised that number to 26% of total spending (vs. 16% in 2011).
About the data: Ad spending projections are issued by Forrester Research, based on a variety of sources, including Forrester's December 2010 US Interactive Marketing Executive Online Survey, fielded to 252 US interactive marketing professionals, who indicated they are decision-makers and influencers of interactive marketing budgets.


