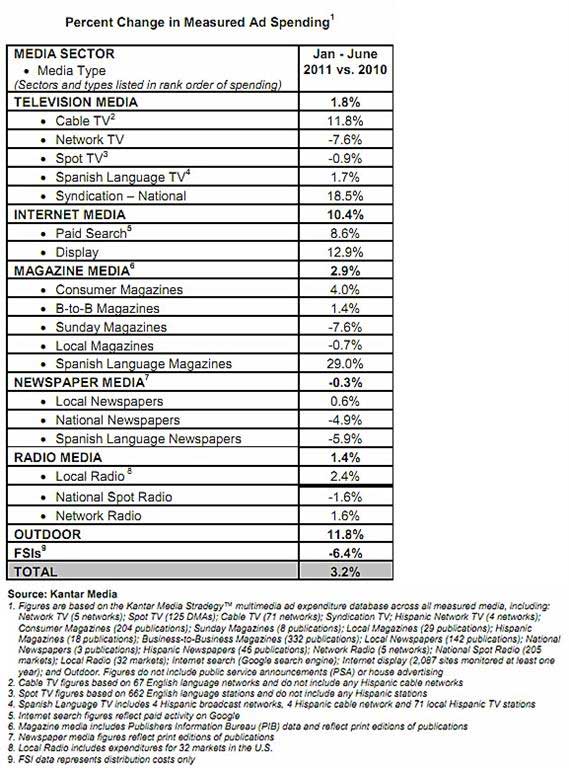
Total measured advertising expenditures reached $71.5 billion in the first six months of 2011, up 3.2% from the same period one year earlier, according to data released Kantar Media.
Spending growth eased slightly during the second quarter, reaching $36.5 billion, up 2.8% from a year earlier.
In terms of growth, the top media categories in 1H11 were Spanish-language magazines, up 29.0% from 2010 levels, national TV syndication (up 18.5%), Internet display ads (up 12.9%), and cable TV (up 11.8%). B2B magazine revenue grew 1.4% in the first half.
"Advertising grew at a slower rate in the second quarter, contributing to speculation about the durability of an advertising recovery that is into its second year," said Jon Swallen, SVP Research at Kantar Media North America. "Key ad spend indicators are painting a mixed picture. On one hand, a majority of media types actually improved their performance from Q1 to Q2."
"On the other, spending growth for the top 100 advertisers stalled in Q2 and the ad market became more dependent on the comparatively smaller budgets of mid-sized advertisers as the main source of growth."
Below, measured ad expenditure-related data and analysis from Kantar Media.
Measured Ad Spending by Medium
Among key media sectors in the first half of 2011:
- In the TV sector, spending on cable networks grew 11.8% in 1H11 over 1H10 levels while Network TV spending fell 7.6%. Syndication TV spending surged 18.5%, reflecting more hours of monitored programming and larger budgets from auto insurers and CPG marketers.Spanish Language TV recorded a 1.7% increase in first-half spending as declines from bellwether telecom advertisers were offset by expanded budgets from a few financial service providers. Outlays on Spot TV fell 0.9%, reflecting weakness from the telecom category and a slowdown second-quarter spending by the auto industry.
- Internet media accounted for more than one-half of the dollar gain in total ad expenditures during the first six months, up 10.4% over 1H10 levels. Display spending jumped 12.9% and Search investments rose 8.6%, each benefiting from a surge of money from the travel, local service, and insurance categories.
- The pace of spending in Radio media remained soft in 1H11. Local Radio was up 2.4% over the previous year, and National Spot Radio fell 1.6%.
- Outdoor advertising, up 11.8% in 1H11, was paced by healthy increases from local service businesses, banks, and TV media outlets.
- Newspaper media continued to lag the overall market in 1H11, dragged down by National Newspapers (down 4.9% over 1H10 levels) and Spanish Language Newspapers (down 5.9%). However, the Local Newspaper segment ended its streak of 22 consecutive quarters of spending declines with a 2.5% increase in 1Q11 and a 0.6% gain in 1H11.
Ad Spending by Advertiser
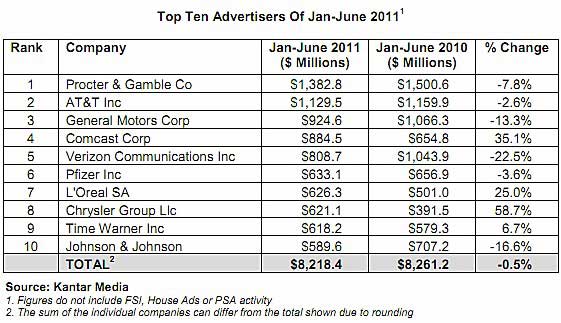
The top 10 advertisers in the first half of 2011 spent a combined $8,218.4 million, up 0.5% from 1H10. Among the top 100 marketers, a diversified group accounting for close to one-half of all measured ad expenditures, budgets rose a miniscule 0.8%.
Among the top 10 advertisers in 1H11:
- Procter & Gamble maintained its top-ranked position, spending of $1,382.8 million in 1H11, down 7.8% from 1H10 levels. The company has been shifting budgets into Spanish language media and Internet display at the expense of Consumer Magazines, Network TV, and Cable TV.
- AT&T was the second largest advertiser for the half year period with expenditures of $1,129.5 million, down 2.6%. Since the March 2011 announcement of its agreement to purchase T-Mobile, AT&T ad spending has slowed sharply. At competitor Verizon Communications, first-half ad budgets were $808.7 million, down 22.5% and the biggest percentage decline among the top 10 marketers.
- Only two carmakers were among the top 10 advertisers in 1H11 (vs. four in the first quarter of 2011). Chrysler Group hiked ad budgets 58.7% to $621.1 million, the largest rate of increase among the top 10. Spending was bolstered by several marketing introductions for new and redesigned models. General Motors reduced its six-month spending 13.3%, to $924.6 million.
- L’Oreal investments rose 25.0% to $626.3 million. Comcast (up 35.1%, to $884.5 million) and Time Warner (up 6.7%, to $618.2 million) also upped their ad budgets.
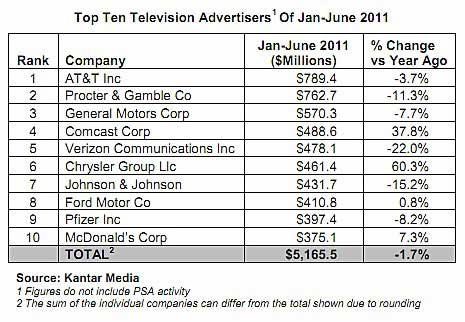
Top Spending Advertisers Within Medium*: Television
The top ten TV advertisers spent $5,165.5 million in the medium during the first half of 2011, down 1.7% percent from a year earlier. The top 10 group accounted for 15.7% of total TV expenditures by all advertisers:
Looking for great digital marketing data? MarketingProfs reviewed hundreds of research sources to create our most recent Digital Marketing Factbook (May 2010), a 296-page compilation of data and 254 charts, covering email marketing, social media, search engine marketing, e-commerce, and mobile marketing. Also check out The State of Social Media Marketing, a 240-page original research report from MarketingProfs.
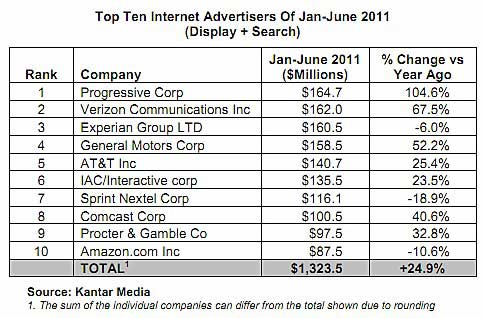
Top Spending Advertisers: Search and Display
The 10 largest Internet advertisers invested some $1,323.5 million in search and display campaigns, up 24.9% from one year earlier. Despite fragmentation on the Web, the group accounted for 11.1% of all Internet ad dollars. The three leading wireless telecom providers each made the list along with two financial advertisers:
Measured Ad Spending by Category
Expenditures among the 10 largest advertising categories totaled $40,982.7 million IN 1h11, up 4.8% over 1H10 levels.
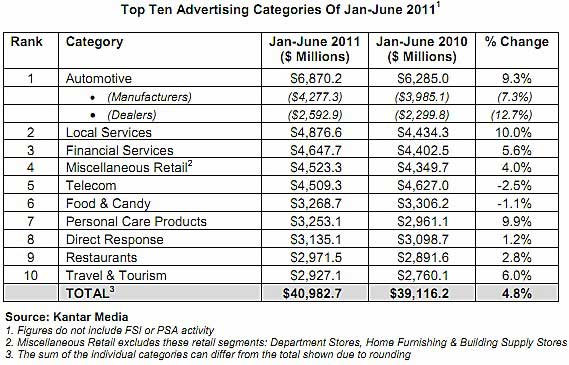
Among the ad categories in 1H11:
- Automotive was the top category with $6,870.2 million of ad spending in the six month period, up 9.3% from 1H10 levels. However, after a torrid first quarter auto marketers hit the brakes and second-quarter spending inched forward only 0.8%. It was a complex environment with Toyota and Honda suffering post-earthquake inventory disruptions; wavering consumer confidence; reduced marketing incentives from manufacturers; and a slowing rate of new vehicle sales across the industry.
- The Local Services category had the strongest rate of growth among the top 10 with a 10.0% increase to $4,876.6 million. That performance is consistent with the category's weighting towards mid-sized advertisers, a segment that has been spending robustly.
- Escalating competition among credit card marketers was the catalyst for a 5.6% jump in Financial Services ad spending, to $4,647.7 billion.
- The Travel & Tourism category entered the top 10 with outlays of $2,927.1 million (up 6.0%) as marketers launched campaigns targeting the peak spring and summer travel seasons.
- After an extended run-up, expenditure growth rates for package-goods categories are falling back. Food & Candy was down 1.1%, $3,268.7 million. Ad spending for Personal Care Products slowed in 2Q11 but still finished the half year up 9.9%, to $3,253.1 million.
*For the first time, this quarterly report from Kantar Media includes paid search advertising expenditures. Search advertising has been incorporated on a like-for-like basis for 2011 and 2010 time periods.
Note: Kantar Media monitors branded entertainment within network prime time and late night programming. The tracking identifies brand appearances and measures their duration and attributes. Given the short length of many brand appearances, duration is a more relevant metric than a count of occurrences for quantifying and comparing the gross amount of brand activity that viewers are potentially exposed to in the program versus the commercial breaks.
About the data: Kantar Media tracks all media (print, radio, TV, internet, social media, and outdoors worldwide) for a full range of media insights and audience measurement.


