You may have heard that the traditional marketing funnel is dead. It's true that what used to be a linear path from attracting leads and converting them into customers is now a multi-faceted process than can start and stop in various parts of the funnel. With so many key entry and engagement points and possibilities, many have abandoned the idea of a funnel entirely.
Today, in this digital age of mobile, social media, and brave new world of marketing, we're going to build a new type of funnel, one that's crafted in accordance with to your business and your audience.
Visualizing Your Digital Marketing Funnel
Put aside previous notions about how a funnel is structured, or even how it looks. Take a look at this image of a digital marketing funnel:
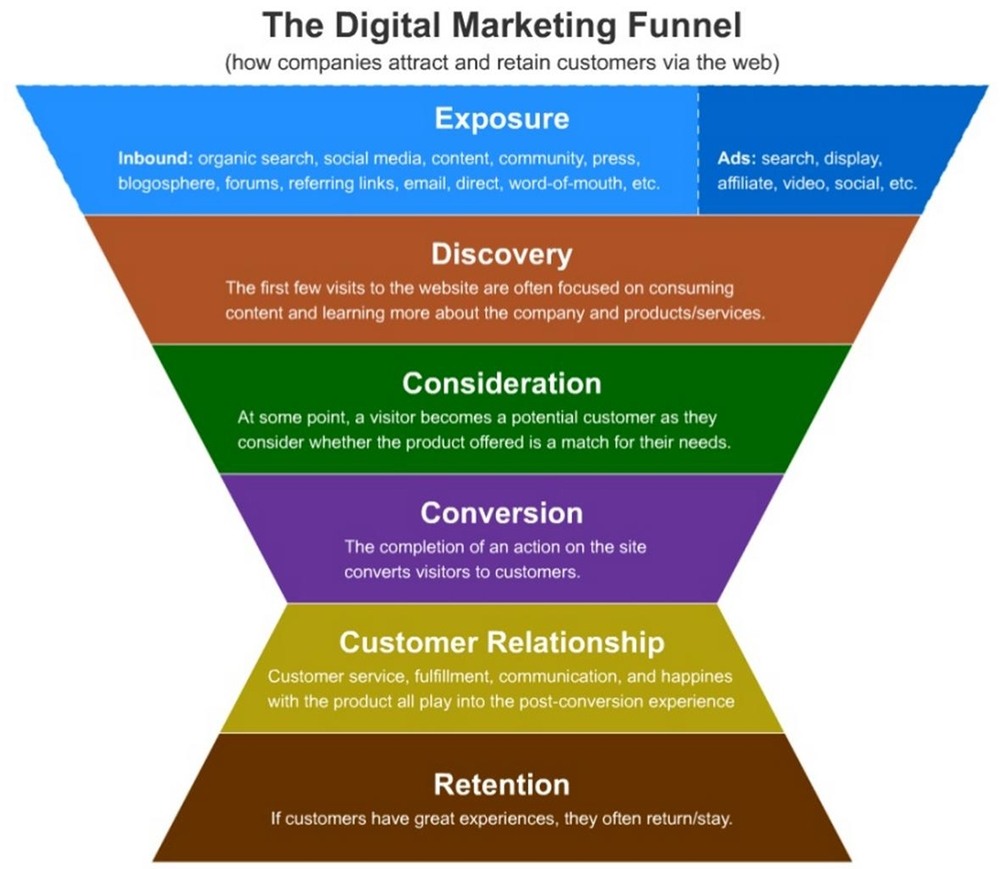
We can divide that funnel into three sections:
- Top of the funnel (TOFU)
- Middle of the funnel (MOFU)
- Bottom of the funnel (BOFU)
I recently read an enlightening Moz post that took that digital funnel and paired it with some lesser-known features of Google Analytics to pinpoint the specific marketing channels that are working best for businesses.
We'll be doing something similar to help you understand which avenues are bringing you the most results, and how they fit into the flow of this digital marketing funnel, will help you maximize your marketing efforts and optimize conversions. This approach builds a funnel specific to your business.
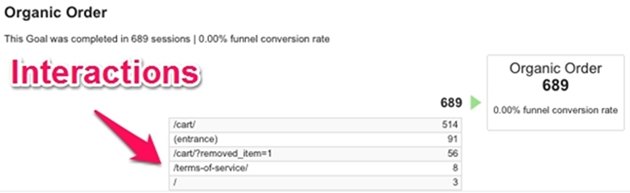
Before we break down the various parts of the funnel, let's take a look at a feature in Google Analytics called Assisted Conversions. Specifically, we need to look at the assisted conversions themselves, and the last click/direct conversions. Here are definitions of each, paraphrased from Google's Answer Bin:
- Assisted Conversions refers to the number and values of sales that resulted from various channels assisting in an ultimate conversion. Any channel that involves a touch during the process of bringing people to the site, if that interaction wasn't the one that finally created a conversion, is credited with an assisted conversion.
- Last Click/Direct Conversions refers to the channel where sales were completed and conversions took place. The final click credit goes to the channel that drove the lead through the lower part of the funnel, straight to the sale.
We will now use Google Analytics to see which channels are assisting in and closing sales in your funnel. Doing so will help you find out how to structure your approach and generate revenue via your blog or other site.
Using Google Analytics to Structure Your Funnel
Now we're going to use your Google Analytics results to help build a funnel that works for your business. For starters, you'll need to ensure that these items are in place:
- Email URL tracking
- Social network tracking
- Display tags, in addition to tags for the items below
- Referral links
- Paid search campaigns
- Affiliates
You can put together a campaign using one of Google's handy tools.
The Top of the Funnel
The top portion of the digital marketing funnel represents the first interactions your customers have with your brand. In today's world those interactions could come from a variety of directions. The most common ones are organic search results, but your mileage may vary.
The first step is to determine which channels people are using to discover your content. To find out, go to Content > Site Content > Landing Pages. Export the data to excel, then pivot it to see which interactions are bringing the most traffic to your site. Your pivot table should look like this:
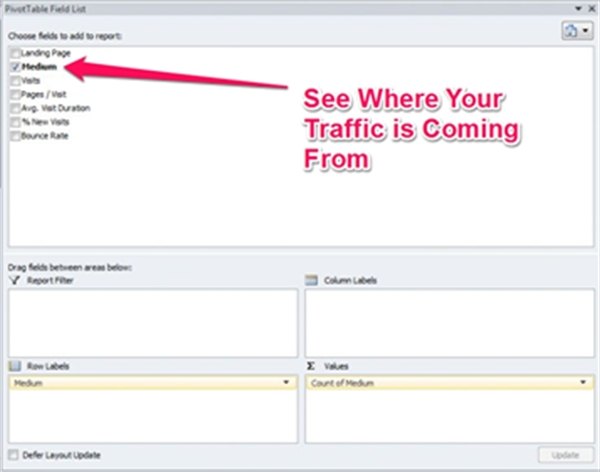
For the sake of this example, the main driver of traffic will be paid search or PPC campaigns. Now that we've identified the medium, we need to find out how much that channel is contributing to conversions.
The Middle of the Funnel
In the middle of the funnel, potential leads are moving forward from a first interaction toward a sale—or possibly a subsequent sale, depending on their experience with your brand thus far.
The part of the funnel doesn't focus on first or last-clicks, but instead looks broadly at the channels to see which ones are driving the most conversions, regardless of their place in the funnel:
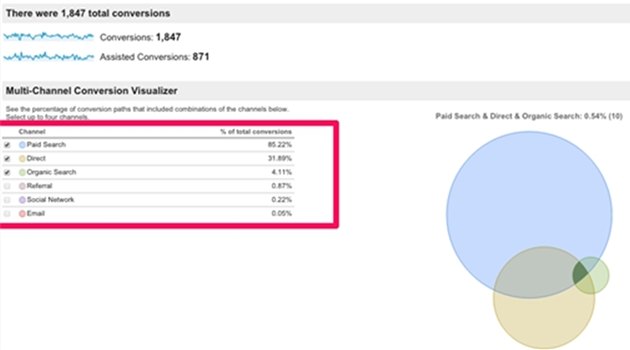
Here we can see the paid search and direct channels are driving the majority of conversions.
The next step is downloading the first and last-touch interactions via the Top Conversion Paths report in your Google Analytics.
When you download those into Excel, you'll find that you have two columns:
- Conversions
- Conversion Value
You can add additional columns to better organize the data. Here are some suggestions:
- First touch
- Last touch
- All Middle
- Dollars/conversion
- Steps in Conversion Path
To further clean up the data, you'll want to set a threshold for the data you're looking at—removing anything with more than 10 steps in the path, for example, or conversion values lower than $40.
Deciding the thresholds involves looking at your conversions and eliminating the ones that are below the value you typically track. Paths with fewer steps are also better to focus on than ones that take more input from the user.
Once you've made your determination, use the pivot table to pull the data into a "common middle" sheet. This is what that table should look like:
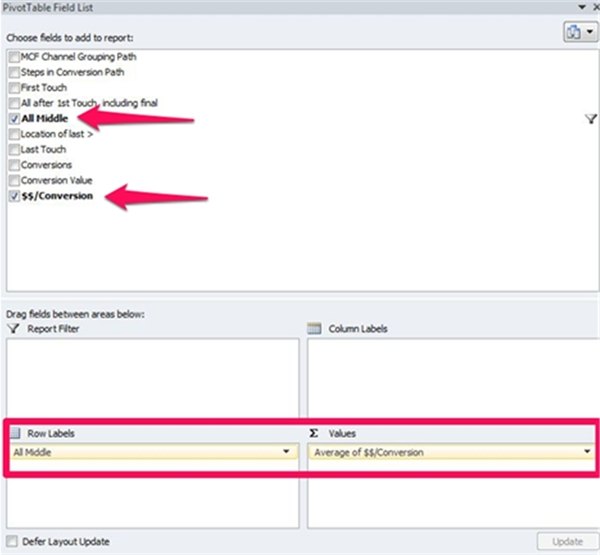
Ultimately, what you're looking at here is how your leads are interacting with your site once they enter it via the channels you identified earlier in the funnel.
Now we move to the bottom and close the sale.
The Bottom of the Funnel
The final touch before someone makes a purchase is located at the bottom of the funnel. These channels are of the utmost importance because they allow you to build your strategy from the bottom up.
The final-touch data can be found by going to Conversion > Attribution > Model Comparison Tool. When you arrive, you'll see this:
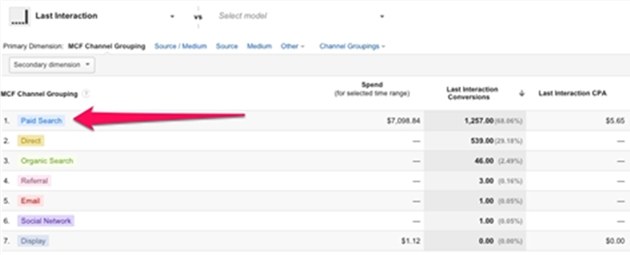
As you can see, the top channel for last-touch results is Paid Search.
Bringing It All Together
Using the data you've uncovered, you can structure your own funnel by looking at how customers are entering, interacting, and converting on your site. Use the tools in Google Analytics and the spreadsheets described above to plot the exact paths your customers are taking. Doing so will allow you to create a funnel of your very own that's adapted to your specific business needs.
More Resources on the Digital Marketing Funnel
How to Use Video for Every Stage of the Sales Funnel
Flip It, Turn It, 'Bop It!' The Traditional Marketing/Sales Funnel Is Out, So What Really Works?
Making Webinars Work—Up, Down, and Beyond the Sales Funnel [Infographic]