Online video viewers living in blue states watched 26% more video content than those living in red states during the second quarter of 2012, according to Ooyala's Q2 Global Video Index Report, which also found that the proportion of time tablet viewers spent watching premium, long-form video (e.g., TV shows and movies) jumped 47% over the previous quarter.
"Blue states" are those in which the Democratic candidate won the previous US presidential election (in 2008), whereas "red states" are those in which the Republican presidential candidate won.
Below, additional findings from Ooyala's 2Q12 Global Video Index Report.
Across the 50 states, people in Massachusetts had the highest viewership (online video plays relative to population). Each state's video plays were then divided by that maximum so that Massachusetts equals 1.0 on a normalized viewing scale and all other states appear as a fraction of 1.0.
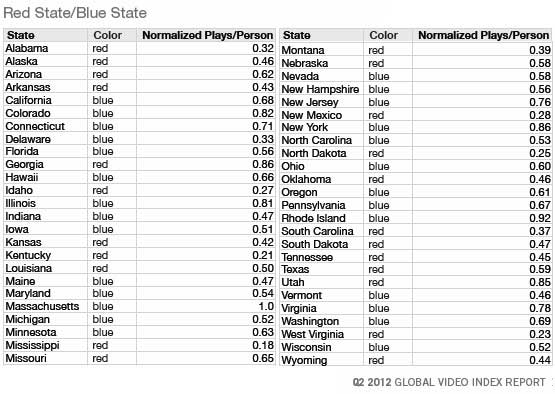
However, neither red states nor blue states were uniform in their online video viewing patterns.
In Georgia (a red state), for example, viewers watched four and a half times more online video than viewers in Mississippi (also red) (0.86 vs. 0.18).
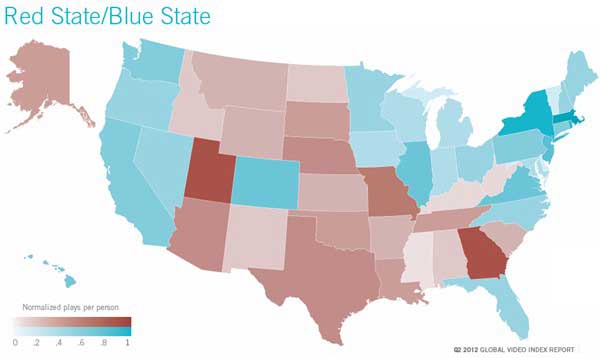
The following US map depicts video viewership of red and blue states:
Most Video Is Now Premium, Long-Form Content
Overall, long-form content—defined as videos lasting longer than 10 minutes—accounted for 60% of the total time people spent watching online video across all connected devices, up from roughly 50% in 1Q12.
Tablet Viewing
During the second quarter, two-thirds of the videos viewed on tablets were long-form video, compared with about one-half the total videos in 1Q12.
Moreover, people spent more time watching long-form video via their tablets than on any other connected screen (except for connected TVs and gaming consoles).
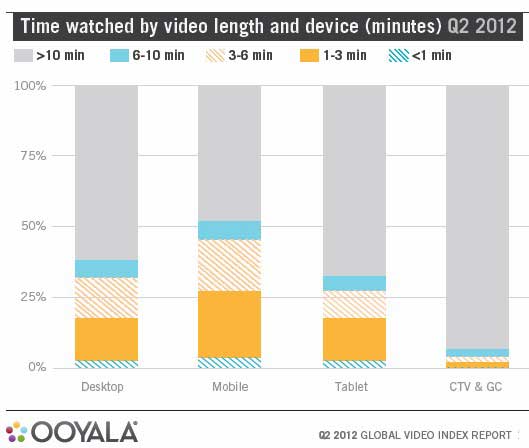
By contrast, time spent watching long-form video content via smartphones grew 17% during the quarter, from 41% in 1Q12, to 48% in 2Q12.
Other highlights from the Q2 2012 Global Video Index report:
- In the UK, 15% of the total time spent watching online video occurs on mobile phones and tablets, compared with 11% in China.
- Live video is on the rise: PC viewers tuned in to live videos for an average of 33 minutes in the second quarter.
- When using smart TVs, set-top boxes and gaming consoles, viewers spend 93% of their time watching movies, TV shows, and other long-form videos.
About the report: The data sample used in this report covers the second quarter of 2012, from April 1 to June 30, 2012. The data were compiled via an anonymous cross-section of Ooyala's customer and partner database—an array of broadcasters, studios, cable operators, print publications, online media, and consumer brand companies in over 30 different countries. Collectively, more than 100 million unique viewers watch an Ooyala-powered video every month in 100 countries across more than 5,000 unique domains. The data sample is not intended to represent the entire Internet or all online video viewers.


