From stats and scores to game footage, mobile devices played a huge role in sports content consumption in 2012, according to Nielsen's 2012 Year in Sports summary, including its annual list of the year's most marketable athletes.
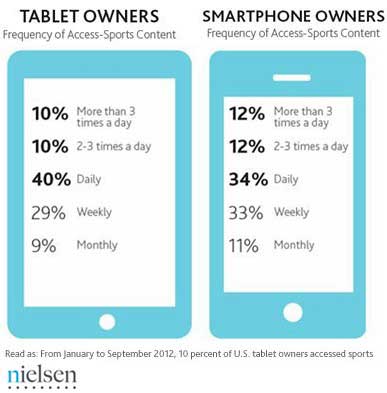
Nearly 60% of smartphone and tablet owners accessed sports content via their device at least once a day from January to September 2012, Nielsen found.
In addition, some 12% of smartphone owners and 10% of tablet owners did so more than three times a day:
Below, additional findings from Nielsen's 2012 Year in Sports, which reports on sports-related insights for the NFL, NBA, MLB, NHL, motor sports, golf, soccer, NCCA sports, NCA, and the 2012 Summer Olympic Games.
Top Devices for Checking Scores and Stats
Though sports content comes in many shapes and forms, sports fans typically pay most attention to the latest scores and stats.
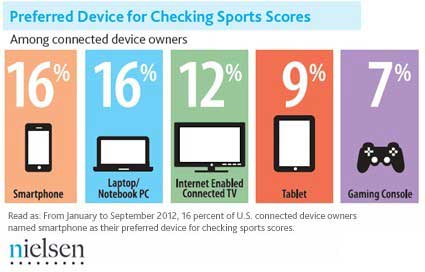
Among owners of multiple connected devices, smartphones and laptops were the preferred device for checking sports scores (16%, respectively), followed by Internet-enabled TV sets (12%), tablets (9%), and gaming consoles (7%):
Sports fans were also active on social media during the year: 41% of all TV-related Tweets were about sports programming, though sports accounted for only 1.3% of all TV programming.
Most Marketable Athletes
To determine the most marketable athletes, Nielsen partnered with E-Poll Market Research to create the "N-Score," a metric that measures the endorsement potential of athletes.
To calculate the scores, Nielsen polled roughly 1,100 Americans age 13+. The results are based on the public's awareness of the athletes and on a series of questions pertaining to their appeal and attributes.
Among moms surveyed, Michael Phelps is the most marketable athlete in the US, with an N-Score of 497, whereas among dads, that award goes to Peyton Manning with a score of 553. For dads, the second place winner, Danica Patrick, trails Manning by some 192 points.
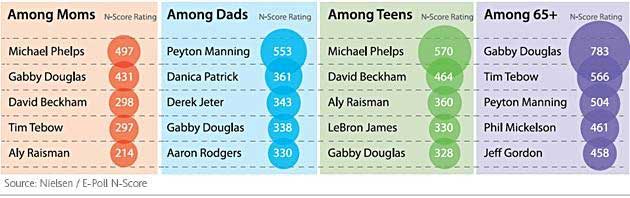
Teens rank Michael Phelps as the most marketable athlete (with an N-Score of 570), while Americans age 65+ favor Gaby Douglas (783) and Tim Tebow (566).
Other key findings:
- There were nearly 60,000 programming hours of sporting events on national broadcast and cable television in 2012, up 45% from 2011 levels. That jump was driven in large part by the 2012 Summer Olympics.
- Most sporting events were watched live: 99% of sports events were consumed within the same day of airing among viewers age 18-49.
- Some $13.3 billion dollars was spent on sports events programming in 2012, accounting for 23% of national TV ad spend.
- TV viewers who recalled ads were 10% more likely to remember the advertiser's brand during sports programs than during non-sports programming in 2012.
About the data: All findings are from Nielsen Company, January to September, 2012. N-Scores were based on a poll of roughly 1,100 Americans age 13+, conducted by Nielsen and E-Poll Market Research.