You may or may not be using the basic segmentation strategy of RFM (recency, frequency, monetary)—that is, dividing your mailing list into a few buckets based on recency in ordering or visitation to the site, the number of times they've ordered or visited the site, and the lifetime spend.
My issue with RFM models is that I would instead like to see each threshold between activity, and tweak it on an ongoing basis. That's the joy of email marketing, it's all so available and adjustable, and in real time.
The common issue I see is that it's difficult to report against the nice divisible cells we've made; so, before we continue, first make sure that your ESP can report back to you performance by cell.
Ideally, your ISP (or you, if you are in-house) can do response filtering: e.g., "Did not click on offer last week, was in Cell X." (Responsys has separate filters from segments, and YesMail has cell reporting if you ask for it.)
Analysis
Make sure you do some analysis on your customer base before breaking down the groups. Creating a group of revenue buckets divisible by 10 makes nice round numbers, but do they really relate to your customer's spending behavior?
What is the goal? Is it more product variety, more new customers, higher spend, more average spend, more lifetime spend...?
Let the data tell you (instead of you telling the data) where those boundaries and thresholds are, between each stage.
Examples
Let's say that company A is an RSS feeder. It notices that if customers set up three feeds they tend to stay with the customer far longer than those who set up two. The segmentation strategy would therefore separate along that line: those who set up two, and those that set up three.
Or, in online sales, if you're trying to push a certain high-ticket item, how many low-ticket items do customers buy before going for the pricier ones? That threshold amount is a key boundary for segmentation.
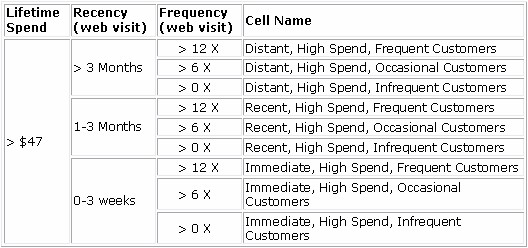
The following matrix outlines a beginning strategy used by a company with online retail sales and some online services. It built a kind of hybrid RFM model with online Web site visitation, since it noticed that its online services were part of the goals. I've stopped after Cell 9 for brevity, but you get the idea.
Reporting on Segmentation
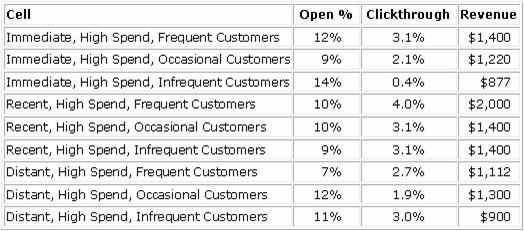
The basic report shows segmentation according to response metrics (open rate, clickthrough) and revenue.
Segmentation is so key, not just because it finds valuable candidates to message but also because you find out so much about your population after the messaging.
For example, the cell "Immediate, high spend, infrequent customers" has dramatic results: highest opens, but lowest clickthroughs. Could infrequent, but high spenders suffer from image suppression, or are they experiencing some letdown from the subject line?
I would spin off a separate small campaign and test creative and offer variances to lift that segment.
Transparency
Sometimes it serves to reveal the targeting to consumers: An email from Snapfish recently notified me that it knew I "hadn't uploaded since joining." Key metric for them is upload or not, and the recency, or existence, of that behavior.
New Techniques
One interesting method is to segment not at the threshold but slightly before.
Targeting folks at $10 before they make a peak threshold can figuratively push them over the conversion peak: If you know that $50 is a breakpoint in loyalty and spend for your customers, target $40 lifetime spenders, and see whether their metrics justify the breakpoint, then integrate into a segmentation strategy.


