Which types of content are brands sharing most often on Facebook? Do engagement levels vary by post type? How many posts are businesses creating on average per month? Has the number of video posts increased significantly this year?
To find out, Quintly examined more than 80 million Facebook posts (photo, video, link, status, and other types) shared between June 2014 and June 2015 by more than 100,000 accounts.
Below, key findings from the report.
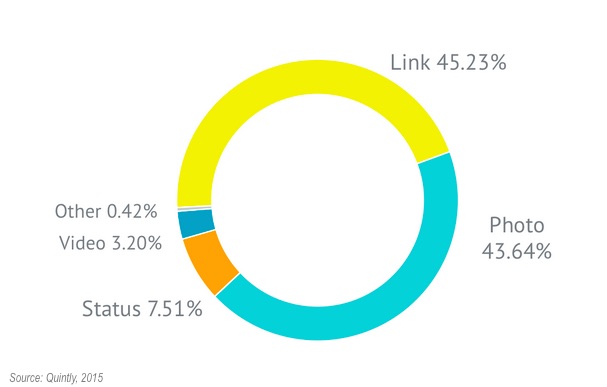
Post Types
Some 45% of the Facebook posts examined were links, 44% were photos, 8% were status updates, and 3% were videos.
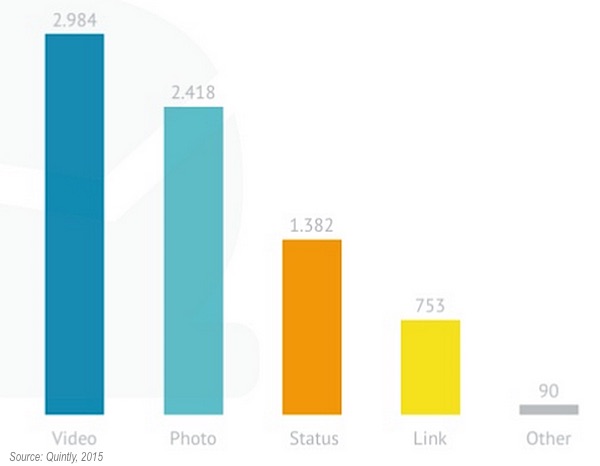
Engagement
Video posts receive the most interactions (likes, comments, etc.), on average, followed by photos, status updates, and links.
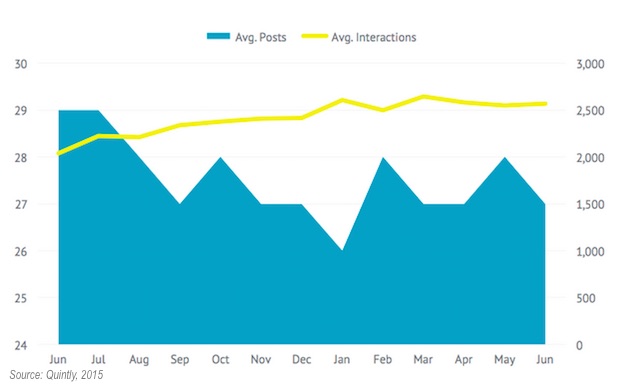
Number of Posts
Marketers share 27 posts per month, on average, to their company's Facebook Page.
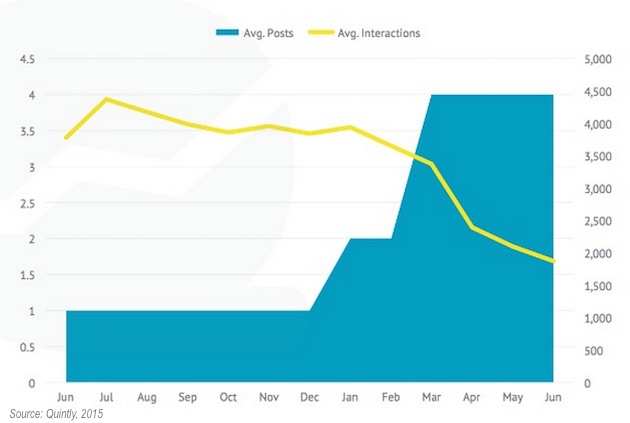
Video Posts
- The number of video posts has been rising significantly since the beginning of 2015.
- As the volume of videos has increased, the average number of interactions per video post has decreased.
About the research: The report was based on an analysis of more than 80 million Facebook posts from 100,000 accounts shared between June 2014 and June 2015.