Many marketers are more comfortable with words than with numbers, but if you're willing to run a few equations, you might gain tremendous insights into the success of your content marketing.
And, more important, you'll probably be more likely to keep your job.
Here's a look at how to compute seven content marketing metrics that would make your math professor proud. They'll also help you quantify your content marketing efforts and, ultimately, prove content's impact on your business's bottom line.
Sales Metrics

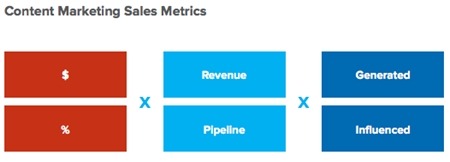
Pick one choice from each column in the chart above and you can calculate a variety of sales metrics, including the following:
1. $ of Pipeline Opportunities Influenced ($ x Pipeline X Influenced). This number refers to the dollar value of pipeline opportunities that have resulted from prospects' consuming one or more of your pieces of content.
You can report on this metric for a single piece of content, several specific pieces of content in a content marketing pyramid, or all content across all channels and parts of your funnel.
2. $ of Revenue Influenced ($ x Revenue x Influenced). This metric is similar to the previous one. You can look at the dollar value of revenue closed, where the contact associated with the deal consumed one or more pieces of your content prior to converting.
3. $ of Pipeline Opportunities Generated ($ x Pipeline x Generated). Using a first-touch attribution model (i.e., you attribute opportunities to the first piece of content a lead engaged with), you can aggregate the total dollar value of all opportunities.
4. $ of Pipeline Revenue Generated ($ x Revenue x Generated). You can also refine the prior metric to reflect only opportunities that actually converted to sale. This is often considered the bottom line metric, because it measures dollars that were actually generated by your marketing.
For each of those four metrics, you can also generate percentage variants to show the impact of marketing on sales. These types of statistics help you quantify the value of your content marketing team in terms that make it easy to justify investment in their existence and initiatives.
For example, you could report on...
- % of Pipeline / Revenue Influenced by Content
- $ of Pipeline / Revenue Generated by Content
Production Metrics
5. Content Backlog
To get a sense of whether you are backlogged in producing content, you can compute the Average Number of Days between Posts (a production metric) divided by the Average Days Since Last Visit (a retention metric):

- If the number resulting from the calculation is greater than one, you are producing content more quickly than your average visitor is able to consume it. You may want to slow down your content velocity a bit so visitors can catch up.
- If the number is less than one, your visitors are likely hungry for more content and you may want to consider increasing both volume and frequency to meet demand.
- If you are at approximately 1, then you are producing content at the right velocity!
ROI Metrics
ROI metrics combine different classes of the metrics noted above, providing a more nuanced perspective on the cost and value of your content marketing.
The range of variations is broad, but here are a few that you may want to consider.
6. Return on Investment
For each piece of content x in Campaign C, take the $ amount of Revenue generated (a sales metric) by Content x - cost, then divide it by the $ Production Cost for x + $ Distribution Cost for x (a production metric). This calculation gives you the ROI factor for that piece of content.

If the ROI factor is greater than 1, then your content was profitable from a sales perspective, not taking into account the contribution margin of the revenue. If the ROI factor is below 1, then keep in mind that there are a lot of other variables that influence revenue and other benefits of content marketing (such as brand awareness and affinity) not included in this analysis.
You can compute ROI for all of your content or individual pieces of content.
C could represent all content produced by a particular writer, and the calculation will give you the ROI for that individual content contributor. If his or her ratio is less than 1, then you might rethink his or her value to your team. If it's above 1, then you know you have a keeper!
7. Pipeline Influence per Word per Writer
Another way to quantify the contributions of individual writers is to calculate the pipeline influence per word per writer. For all content produced by a given writer denoted as W, take the sum over the total pipeline influence for each piece of content x divided by the word count of x. Now you get a metric in the units of pipeline dollars per word.

This is useful because some content writing services charge by the word. If you find that their pipeline influence is less than their cost per word, it may be time to try another service provider with more influence pipeline or a lower rate.
* * *
Using these equations to measure and quantify your content marketing campaigns will help you improve your conversions and hone your strategy. (For more tips, download Curata's free e-book, The Comprehensive Guide to Content Marketing Analytics & Metrics.)


