Analyzing mobile marketing campaign data is a complex process. One wrong number leads to misinterpretation of the entire campaign.
A set of issues arises in this context:
- How to receive quality data to analyze
- How to make the analytics process as transparent as possible
- How to properly measure campaign or app issues with metrics
What Is Marketing Analytics?
In a general sense, analytics is the feedback received as a result of your actions. It is thanks to feedback that a person can make rational conclusions about their behavior.
In business, everything works in the same way: Feedback is needed to analyze previous actions and then form or change strategy. To get feedback, you first need to collect data, which marketing analysis can benefit from.
Therefore, marketing analytics indicates how correct the chosen strategy and the audience for the acquisition is.
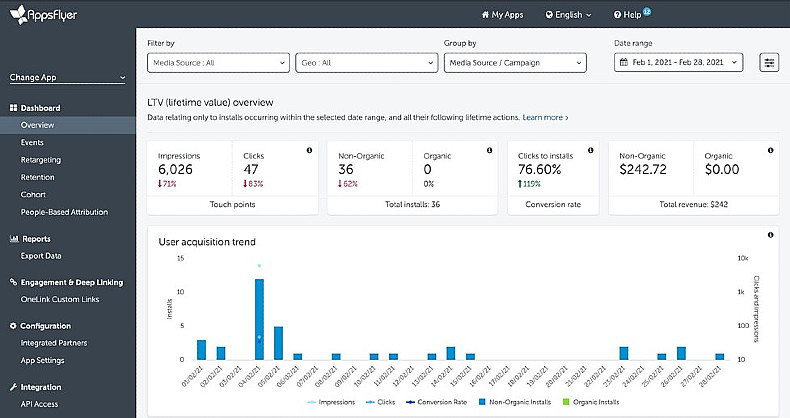
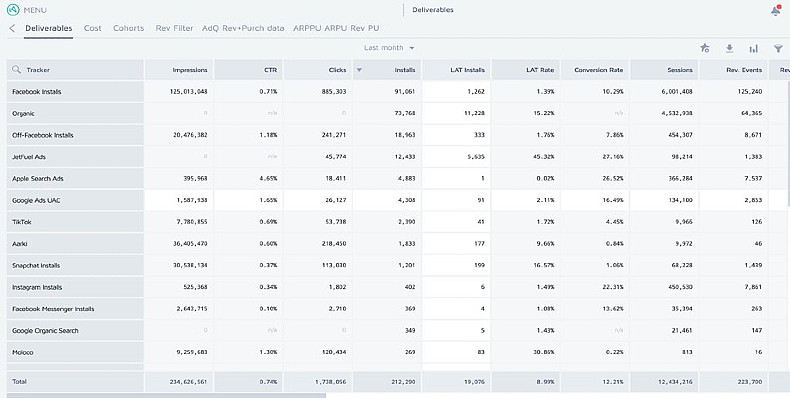
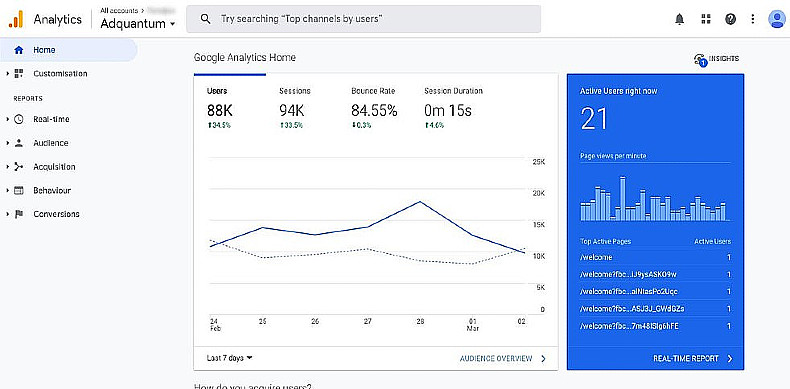
There are a variety of solutions for data analytics in mobile marketing. We at AdQuantum (AQ), for example, most often use tracking platforms such as AppsFlyer, Adjust, and Google Analytics.
Data Analysis Principles
How can you avoid pitfalls and analyze data correctly? Here are some guidelines:
- Relevance is crucial to understand exactly what we are analyzing. For example, does it make sense to compare those countries we are comparing? Tier 1 countries (e.g., USA, Australia) and Tier 3 (e.g., Cuba, Korea), for instance, have different-quality traffic, so the data on them may differ significantly.
- Seasonality is a common concept in mobile marketing. We need to understand for which periods of time we compare the data. For example, data for December of 2019 should be compared with data for the same month of 2020. The approach should be the same during a given month or even week: Weekends should be compared to weekends, for example, because the activity of mobile app users is much higher on weekends.
- Context partly includes seasonality and other data parameters, such as optimization types of the analyzed campaigns. Do not compare CPI in an app install campaign to CPI of a campaign with ROAS optimization. Those metrics can vary enormously. That would be like comparing an apple to an avocado: Yes, both are fruits, both can be green, but they are otherwise very different. Base analytics on the product's end goal when selecting the data for analysis.
Before starting the analysis, it is better to figure out what data you are going to be dealing with. Comparing initially disparate metrics or choosing the wrong key metrics can be misleading or simply useless.
Metrics Interpretation
A metric is a qualitative or quantitative indicator reflecting a particular characteristic and level of a product's success. Any marketing metrics are just numbers, they do not make much sense without interpretation. It also makes no sense to analyze all marketing metrics at once; each one must be considered for specific purposes.
Let's divide them into various groups.
Product Metrics
Daily, weekly, monthly active users (DAU, WAU, MAU); revenue; retention rate (RR); and churn rate (CR)... all provide a general understanding of the situation: How many users there are in the app, how do they like it, how much they pay and how many of them leave the app.
However, those metrics do not allow us to make certain marketing decisions or to measure the impact of product changes. When working on an app, the main thing is its volume, not the mass.
Lifetime value (LTV), average revenue per user (ARPU), customer acquisition cost (CAC) and return on investment (ROI) are the metrics defining the product's financial success and its value to the user.
Marketing Metrics
Cost per mille/thousand (CPM), cost per install (CPI), clickthrough rate (CTR), install rate (IR), engagement rate (ER), cost per action (CPA), conversion rate (CR) and return on advertising spend (ROAS) are the main metrics for marketers.
CTR, IR, and CR are especially important. They allow us to draw conclusions about the efficiency of our work on the product and show the quality of the acquired traffic.
How to Organize Analytics
When starting a performance campaign analysis, it is of paramount importance to define your goal: What exactly do you want to solve with this particular analysis?
Once the goal is defined, it is time to strategize and gather all the data needed. Based on our experience, we have determined rules that allow us to organize transparent and high-quality analytics:
Benchmarks
These are the metrics the product already had up until they started working with us. They allow us to find out how well our campaign performs compared with the past.
Complete Information
For analysis to be objective, you need to have all the details in the big picture of the data: From which traffic sources are we taking metrics? Which countries? Types of optimization? Traffic volumes?
It makes a huge difference whether we are considering metrics from TikTok or from Google Ads; whether traffic comes from the USA or from India; whether the campaign was optimized for installs or for conversions; whether we are gathering data from 100 users or from 1 million.
Data Appropriateness
Suppose that a product team provides us with a set of metrics: IR, CPI, CR, and CPA. Now we have four metrics, but they do not have much meaning for us as long as we do not understand which traffic sources they are taken from.
Facebook, TikTok, Snapchat, and Google Ads, for instance, all have their own characteristics, which is why if we run a Facebook campaign, we have to consider benchmarks from that particular traffic source. It's the same with countries: It would be incorrect to take worldwide data as a benchmark if we run a US campaign.
The Importance of Well-Chosen Data
Marketing analytics starts with good-quality, relevant data. A lot depends on the completeness and reliability of the collected information: KPIs in reports, decisions on where further to direct the campaign, and how much money the project will ultimately earn. Poor data handling is the first reason for losing time and money—both for the client and marketing agency.
Not sure which marketing strategy is right for you? You want your product to start growing? Let's talk.


