Metrics are all the rage today. The ubiquitous saying "You can't manage what you don't measure" is being played out on every corporate stage. All of this attention does beg some questions, however:
- How many things should you measure?
- What metrics are really important?
- Should you trust the number?
- What do you do now?
These questions, and more, will be discussed in this article, along with deconstructing or unraveling a metric to better understand and test it. Most of the principles I'll discuss are timeless.
I'll start with some basic definitions, and then move to a robust statistical principle, then to stratifying and trending and, lastly, a rousing conclusion.
Define Your Terms
Basically, metrics are a type of precise, quantitative shorthand for colloquial English. Imagine the following discussion between Abigail, a sales executive, and Simon, a sales manager.
"Simon, how is your team doing?"
"We're doing pretty well, Abigail."
"What do you mean by 'well' Simon?"
"My team is performing above expectations."
"Remind me what your expectations are again, Simon?"
You can see how terms like well, good, bad, successful and other such descriptions are quite nebulous unless you have a way to "operationalize" and measure what they mean and unless you have a basis for comparison. As well-known astronomer and dogged critic of pseudoscience Carl Sagan said, "What is vague and qualitative is open to many explanations."
A metric is a standard or unit of measurement. Examples in the business world include cost per lead, win ratio and revenue. A metric is a proxy for something. If your win ratio is increasing, for example, you might infer that your sales people are selling well and your value proposition is strong. You would not, however, want to rely on only one number or snapshot. It's better to triangulate across time, sources and metrics.
A key distinction that many people make is between leading (causes) and lagging (effects) metrics. The former are more behavioral and process-oriented, and should help to predict the latter (e.g., you should test to see if this is the case), which are more financial and results-oriented, such as revenue, profit, and return on equity. Key performance indicators (KPIs) are often associated with leading metrics, but the distinction is not universal.
At the end of the day, managers and executives want some predictive analytics so they can make mid-course adjustments and not wait until the end of the quarter (or some other time period) when it would be too late to do anything. An illustrative adage would be "forewarned is forearmed."
The metric itself is the tip of the iceberg in terms of measurement. It's the measurement system and process that determines whether the metric can be relied upon and trusted. If it's measured in a haphazard way or there's a lot of discretion involved, you are unlikely to fully trust the metric, which is a real problem today. I remember when a sales executive told me that he didn't trust any opportunity in the pipeline below a 90 percent win probability, which was the majority of the deals. It's hard to effectively manage the pipeline when you don't trust the contents.
When it comes to metrics, you want to identify, assess and document all the factors affecting the measurement process, and try to minimize their impact on the measurement.
The Measurement Foundation
One of the fundamental tenets of statistics and measurement is that if a measure is not reliable, it cannot be valid. Read it again. One of the fundamental questions of any metric is whether it is reliable. For example:
- Is it measured in the same way each time?
- Has it been specifically and operationally defined?
- Does everyone agree to, and understand, the definition?
If there were an adage that could encapsulate the idea around reliability, it would be "comparing apples to apples." If what you are comparing, whether it's across time, divisions or people, are not measured in a tenable and consistent fashion, then your interpretation will be flawed.
If you've established that the measure is reliable, then you can determine whether it's valid for its intended purpose. Your weight is valid for measuring how much you weigh, but it is not valid to predicting the stock market (although I'm sure people have tried).
As I've stated in a previous article, there are two types of validity that are most important. One is content validity (or, would a subject matter expert affirm that the metric makes sense?) and the other is predictive validity, which looks at whether the metric predicts what it claims to or should.
Slicing & Dicing (Stratifying)
If someone tells you that their revenue is decreasing (typically, a lagging indicator), your next questions would revolve around understanding what that means. You would begin to drill down or isolate exactly what's driving the revenue decrease. Ultimately, specific action is taken only after you identify the key drivers of the change. The most basic questions are these:
- What time frame are you referring to? For example, last month or the third quarter or last year, etc.
- What is the time frame you are comparing to (decrease compared to what)? For example, year-over-year or sequential (previous month or quarter)
- What revenue are you referring to (revenue for what)? For example, a geography, a unit, an offering, a channel, etc.
- What is the source of your data (can I trust it)? For example, an annual report, a spreadsheet from finance, the sales forecast, etc.
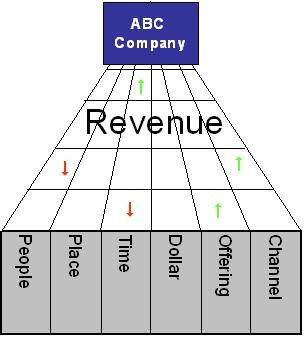
Most companies comprise various divisions, units, products, channels and geographies that you typically need to further clarify, stratify and investigate to get to the heart of a variance. A variance is a symptom of a problem or opportunity.
For example, in understanding a revenue decrease, the following are just some areas to drill into:
- People: What's the 80/20 (the Pareto principle) in terms of sales rep productivity?
- Place: What territories, geographies or theaters are experiencing the largest shortfalls?
- Time: How does the decrease look across time (early/late in the quarter, etc.)?
- Dollar: In terms of deal size, where is the shortfall most predominant (e.g., fewer large deals, etc.)?
- Offerings: Which products or services are experiencing the largest changes?
- Channel: How is the revenue in each channel-to-market trending (e.g., call center, Web sales, field sales, partner sales, etc.)?
Is There a Trend?
If you like to pick stocks, one popular saying is the "trend is your friend." You want to look for macro trends that you can profit from.
In terms of metrics, and as long as you're comparing "apples to apples," you want to understand and diagnose the trend, assuming you have an adequate number of data points, usually 20 to 25. You also want to compare the trend with other companies' in the same space. Even if you have a negative trend, it may be better than your competition. Again, most assessments are relative to some comparison set and timeframe.
As alluded above, the trend is only as accurate and interpretable as the data points underlying it. If the trend chart (it's also known as a run chart or time plot) is built on metrics that aren't reliable, the interpretation of the trend will be erroneous as you'll be acting on measurement error vs. true changes.
Also, a trend is no different from the theme of this article: Most things should be deconstructed into smaller elements in order to identify specific, actionable insight. One way to do this is a trend tree (next figure), which can help you to identify, isolate and improve the key variables driving the change.
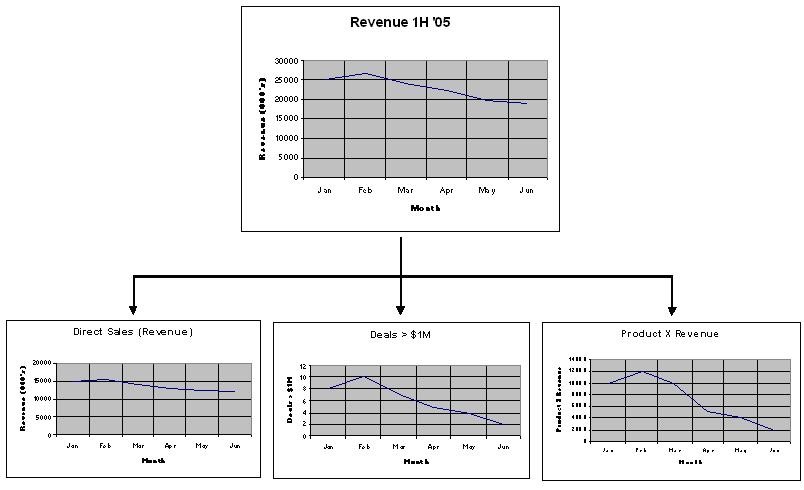
Click to enlarge
In evaluating trends, it's important to note a few distinctions. It's usually helpful to draw a straight line on the chart representing the median value. The median will have half the points above it and half below. It's less sensitive to outliers or extreme values than a simple arithmetic average.
Also, a trend is often defined as five to seven data points in a row with some sort of slope, although a straight or "neutral" line could also be considered a trend depending on the data set. Unless you know what metric you're interpreting (e.g., revenue or costs), the pitch of the slope doesn't tell you whether it's favorable or unfavorable.
The Wrap-Up
Most industries and fields have their own jargon and language. Metrics, like accounting and finance, are a shorthand and language that cut across industries and companies. Some metrics are unique to a particular industry or function, but most are a permutation of the following: revenue, productivity, earnings, expenditures, growth, market share and satisfaction/loyalty.
Traditionally, most metrics have been financial, which still is the case in many organizations. The advent of the Balanced Scorecard has helped to improve the adoption of more leading indicators and predictors of the financial metrics, such as time-to-market, cycle time and customer satisfaction.
According to an American Productivity and Quality Center 2004 whitepaper, balancing financial measures while blending leading and lagging indicators is one of the four key measurement challenges in the 21st century, along with linking measures to strategy, determining the few critical measures and ensuring measurement drives desired behavior.
In answering the questions at the beginning of this article, you should...
- Only measure and report on processes that you would take action on if they materially changed (e.g., if the metric significantly decreases [assuming that's bad], and you do nothing, you shouldn't be measuring it).
- Identify the metrics that have a significant impact on the viability and valuation of the business (e.g., if the metric changes, does it have a significant impact on the business/unit/function?).
- Trust the number if the measurement system and process from which it was derived is tenable, objective and reliable.
- Dig for the root cause the reasons for the change: What are the elements, factors, or variables that are driving the change? Ask the question "why" until you get to a discrete, actionable, measurable step.
And, finally, not everything can be measured easily or without a significant cost. W. Edwards Deming, the great quality guru, once said 97 percent of what matters in an organization can't be measured. Areas such as culture, values and mores are difficult to measure. Most of the proxies are imprecise and incomplete.
Moreover, most of us learn through qualitative dialogue with someone else. We remember stories better than equations. So as important as measurement, metrics and predictability are to an organization, it's critical to look at both the statistics and the stories. All the metrics in the world can't change a bad plot, disturbing theme or inappropriate setting.