When Pablo Sandoval of the San Francisco Giants stepped up to the plate to face Detroit's Justin Verlander in Game 1 of the World Series, each player had a season full of data at his disposal—collected over 162 regular-season games. At home and on the road. Performance in day games compared to night games. In the heat of the summer and in the crisp autumn air.
Because of such valuable accumulation of information, Sandoval knew what pitches Verlander tended to throw in certain situations, and Verlander knew which areas of the strike zone Sandoval was most likely to get a hit.
As marketers, we can learn valuable lessons from both the Kung Fu Panda and the former American League MVP and Cy Young winner.
Lesson 1: Know what your heat map looks like
TV broadcasts are famous for displaying graphics to help audiences understand the game better. One of the best is a heat map that shows the areas of the strike zone where the batter is most effective. Maybe a batter likes the "high heat"—a high fastball—but can't lay off a breaking ball. Pitchers who study this information know where to throw the ball to have the most success.
Marketers, too, must know when and where they are most effective. A marketing heat map can help analyze the success of campaign ingredients. Start by listing all the different activities in your marketing lineup. Then, establish the criteria for three categories: hot, warm, and cold. Building these criteria, which can change from industry to industry and category to category, will give you the opportunity to tailor your definition of success.
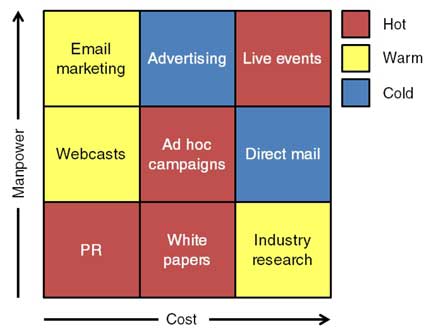 The next step is the most time-consuming, but it is perhaps the most important. Using metrics from your recent marketing campaigns, drill down to the specific activities and analyze whether those activities are working for you. For example, if you are evaluating live events, you might decide to compare the total cost of attendance with the number of qualified leads. Since you've already established your scoring system, it'll be easy to assign a temperature to that category.
The result will be a heat map that shows where you are being the most effective and successful. That knowledge can be used to plan for new campaigns, tweak existing ones to be more effective, or make the decision to stop others.
And since your decision is backed up by the data, it makes communicating with key stakeholders easier.
Lesson 2: Mix up your pitches
Part of what makes hitting a baseball so difficult is that the batter never knows whether the pitch will come at 98 miles per hour or will curve away and drop into the dirt at the last minute. Even the best pitcher is hittable if he throws the same pitch over and over again in the same place.
With that in mind, think about how you run your marketing programs. Do you throw the same type of campaign at your audience every time? Over time, those campaigns will become less and less effective. But if you mix things up and keep surprising your contacts, each campaign will seem fresh and new.
Think of your audience as you construct a marketing campaign. Build toward the end goal—a registration, a click through or a personal contact. Instead of starting from scratch each time you plan something, use one campaign to build on the next. If you zig when they think you'll zag, you'll gain their attention—and you'll be more effective.
Lesson 3: Trust your gut—when the data tends to support it
In almost every game, baseball managers face tough decisions. When to hit-and-run, when to sacrifice bunt, or when to steal a base. Many of those decisions are based on percentages and probability. But some of those decisions are made by instinct and gut feel.
In Game 5 of the American League Division Series this year, New York Yankees manager Joe Girardi benched his star third baseman, Alex Rodriguez, in the bottom of the ninth inning, even though his team was losing 1-0. He inserted journeyman Raul Ibañez as a pinch hitter. On paper, it was a curious and controversial move. Although A-Rod had been struggling, traditional thinking wouldn't recommend—in that situation—benching someone with 647 career home runs.
"I just had a gut feeling," the Yankees manager said.
The move would pay off: Ibañez belted a home run in the ninth inning to tie the game. Ibañez then hit another home run in the bottom of the 12th inning to win the game and the series for the Yankees.
Realize, though, that it wasn't just a gut feeling for Girardi. He also applied some data to his decision. The data showed Ibañez was a good low-ball hitter, and he was facing a pitcher that tended to throw low fastballs. The outfield fence in right field where the left-handed Ibañez tended to hit the ball was closer than the fence in left field. And Ibañez had proven himself to be an effective pinch hitter. It was a tremendous example of making a gut decision backed up with solid data.
A recent article by Adele Sweetwood outlined six tips for creating an analytics-driven marketing culture. One of her tips was to ask, "Do you have the data to support that?"
Marketers tend to create campaigns that are inspired by other campaigns. But determining how effective those new campaigns will be is sometimes akin to throwing darts at a dartboard. We just don't know what the click-through rate, conversion percentage, or registration numbers will be. Sometimes we have to go with our gut because we feel it's the right thing to do.
When we pair that gut feeling with performance data from previous campaigns, A/B testing, and industry best-practices, chances are greatly improved that the campaign will be more effective.
Data is a marketer's best friend. When used strategically, data can help you create more effective campaigns, deliver more high-quality leads, and build better relationships with customers and prospects.
It might sound like playing a broken record, but when you test, measure and adjust your marketing campaigns to respond to a constantly changing environment, you can confidently make the changes needed to increase effectiveness.
And, if you're lucky (and talented), you can emulate Pablo Sandoval and hit a home run—or three—with your upcoming campaigns.
Summary
For more effective marketing campaigns, try these three tips inspired by the Fall Classic:
- Build a heat map of your marketing campaigns to analyze where you're hot and where you're not. Focus on the hot!
- Don't be predictable. Mix up your campaigns to stay fresh and interesting.
- Use historical campaign data along with your gut instinct to make decisions. You'll have a lot less indigestion when you use data to back your gut.