We love funnel metrics. You should, too. They will gain you access to executive leadership at the highest levels of your company and earn you big, fat pay raises and promotions. What's not to like?
Oh, yeah, the math stuff. Don't worry. This will be clear and fun.
First, a little trick. Your funnel focus reveals your level of B2B measurement maturity. Newbies to B2B measurement focus on top-of-funnel metrics: How much traffic? How many leads?
Seasoned B2B marketers focus on metrics that provide context.
Your place on the Funnel Maturity Continuum?
You can break measurement into two broad groups: counts and comparisons.
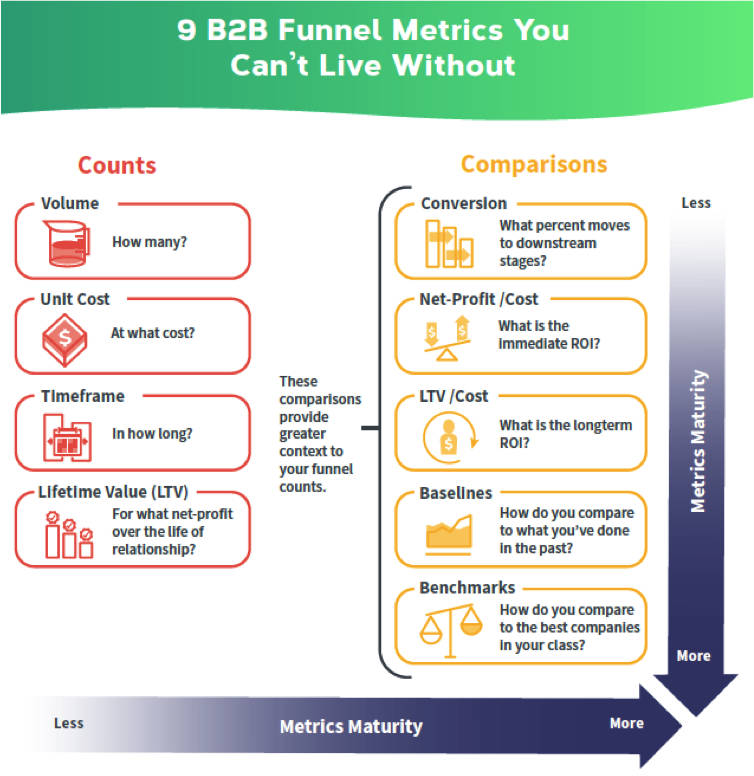
Both are useful. In fact, you can't get comparisons until you have counts.
The 'How Many' and 'How Much' Measurements
- The volume for each funnel stage over time. This metric answers the simple questions "how many?" and "how much?" How many automation-qualified leads? How much pipeline?
You can ask these questions over various timeframes (e.g., month, quarter, year-to-date) for each stage of your funnel. Scale depends on reaching sufficient quantities. However, volume does not always equal growth and profit, something that is hard to see without more context.
- The unit cost for each stage. This metric looks at volumes for a given stage and asks how much each item costs. Most marketing teams measure the unit cost, with cost-per-lead being universal and customer acquisition cost being a close second. Measuring how much it costs you to create a set of outcomes will put those outcomes into useful perspective.
These unit costs serve as a sanity-check. Is the unit cost reasonable given the likely downstream conversion rate and the revenue per unit? Again, looking at the trending of this metric over time can also be helpful. However, don't over-value this metric. Lower unit cost often correlates to lower conversion rates or smaller deal sizes (or both).
- Timeframe. This metric asks how long it takes for prospects to move from one funnel stage to another. You can't project revenue or profit contribution accurately without taking this measurement into account. When timeframes grow longer, that should be a prompt for you to understand why. Often, you can address the obstacle and reduce the cycle time.
- The unit lifetime value for each stage. Lifetime value reflects the expected profit or gross profit over the expected life of the customer. The idea is to take a more holistic view of the value side of the equation. In some ways, that view of the value contribution has probably spurred the current account-based marketing phenomenon as marketers started to understand what sales has known for years: Not all leads or accounts have equal value. And when the likely value is higher, you can afford to invest more to acquire such targets.
Those counts provide a foundation for more telling measurements that make comparisons between the following counts.
The Priceless Comparison Measurements
If you took your lead volume from 500 to 5,000 per year, it would seem as though you were doing a fantastic job. But that's where context comes in. What if the leads didn't close? What if you used to generate 10,000 leads a month, but similar companies generated 20,000 per month? You see the problem? Context is everything. Context comes from comparisons. Here are my favorites.
- The conversion of each stage into downstream stages. It's important to know how many and how much. It's more important to understand the movement from one stage to another. Conversion rates between stages help you isolate why downstream conversions are increasing or decreasing.
- The revenue/cost ratio. Comparing the revenue to the cost at each stage puts both the cost and the revenue into context and answers the question, What's the return on investment? The better this ratio is, the better job you are doing. Of course, there are occasions when speed to market and market share matter more than profit, especially for startups and emerging technologies. Still, you want this ratio to be as good as it can be, given your objectives.
- Lifetime value/cost ratio. Comparing over the life of the customer the expected revenue or profit with the cost of acquisition gives you more context than initial revenue and costs. This metrics helps you minimize our human tendency to be shortsighted.
- Baselines. Baselines are statistically meaningful volumes for each stage that allow you to compare what you are doing now with what you have done in the past. Over time, as sufficient volumes occur, baselines help you answer the question, To what degree are you making things better? Career advancements and big bonuses reside here.
- Benchmarks. Benchmarks allow you to compare your funnel metrics with those of the best companies in your class. This kind of measurement allows you to see what's possible. Before Jim Ryan broke the four-minute mile, everyone thought running four-minute miles was beyond the grasp of human achievement. After he broke the record, however, four-minute miles became commonplace.
Benchmarks can have that same kind of impact on performance, lifting your mind to go higher than you thought possible. It's important, though, to compare your company with (a) the best companies and (b) the best companies in your class. Too many benchmarks show what everyone is doing. Who cares? You want to see what the best comparable companies are doing.
Looking at those metrics can tell you where you are leaking revenue. Considering the complexity of B2B, such a diagnostic is hugely beneficial.
For a deeper look at how to use those metrics, get the free e-book, "How to Scale Your Demand Operations."


