Is your brand relevant to the various audiences—customers, influencers, the media, others—you want to reach? More specifically, how can you find the untapped opportunities for establishing relevance? How can you identify what they want so you can provide it?
In economics, "supply and demand" refers to the relationship between the price at which companies wish to sell their product/service for and the price that consumers are willing to pay for it. The more of something there is, the less valuable it is. The more people want something, the more valuable it is. The balance shifts all the time based on various economic factors.
There's an argument among economists as to what comes first—supply or demand. However, within the context of brand relevancy—the rational or emotional affinity toward your brand by an audience—it starts with demand (primarily for help or information), and understanding demand requires research, data analytics, and audience intelligence.
Content/Topic Demand and Supply
The below model illustrates how supply and demand can be used to determine brand relevance, and how analytics can find white space—a small corner of the market about a specific topic that no one else owns. In short, an untapped opportunity to claim a position.
On the right are various audiences. Demand represents the stories, content, and topics demanding their attention; it answers the question, "What is important and relevant to my audience right now?"
On the left is a self-assessment of the content that you are supplying into the marketplace. The question you have to ask yourself here is, "Am I meeting the demand of my audience with the supply of my content?"
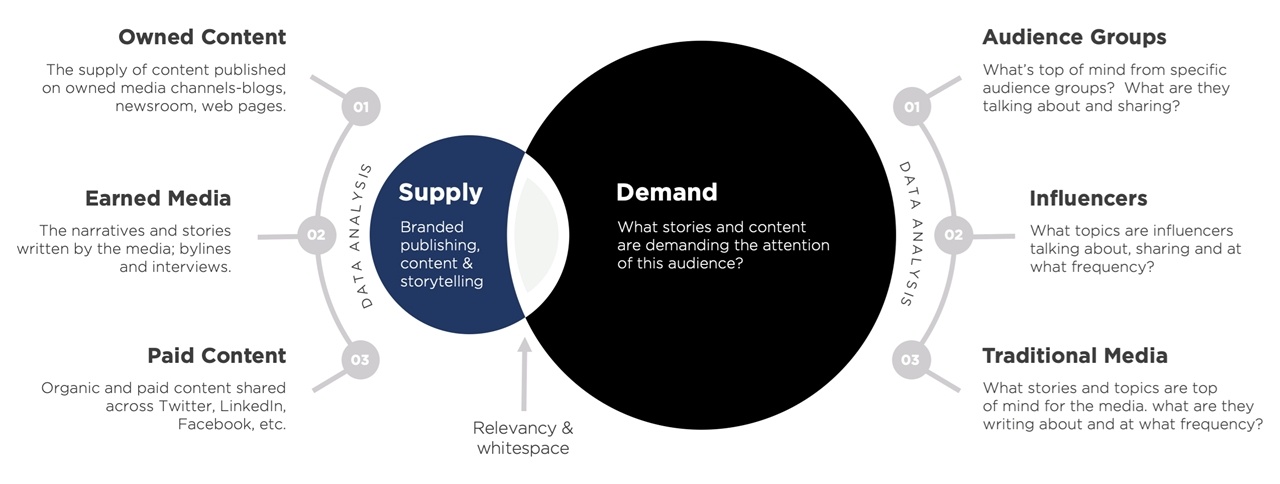
To make this model actionable, you must first determine which audience you want to be relevant to. This is important, because what might be relevant to a group of influencers, for example, may not be relevant to your customers.
And that's where analytics comes in.
Target Audiences
There are several ways to uncover white space in the market in order to become more relevant with an audience, but each one requires a different methodology. Let's start with target audiences.
Audience Groups
There are many ways to curate audiences through bio search, conversations, sharing habits, and common affinities. For B2B audiences, bio search is more accurate. In any event, there are key data points that can be uncovered and used to inform marketing programs:
- Interests and affinities that make an audience unique from other audiences (general population, CEOs compared with CIOs, etc.)
- The social channels they prefer to use and why
- The factors influence their purchase decisions
- The topics they care about the most
- The media publications they prefer to read
Below is an example of a clustered content analysis of IT decision-makers. The visualization represents the topics most important to this audience clustered by volume. It gives us real information on the language used when the audience talks about specific topics of interest.
An analysis in this format will uncover focus areas that might not be apparent when scanning their content manually.
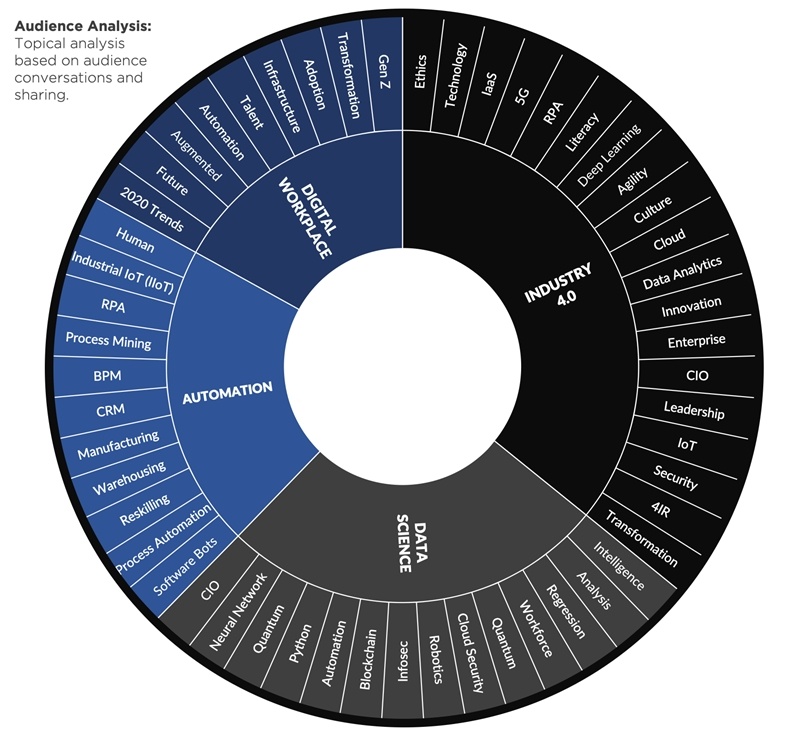
Looking at this data, you'll notice that this audience over-indexes for topics related to Industry 4.0 and Data Science, accounting for roughly 65% of the overall conversation. That means these topics are more relevant to the audience than others, such as Digital Workplace and Automation.
This type of intelligence can help shape campaign messaging, narratives, and editorial content in a way that's more relevant to audience interests and affinities.
Influencers
Influencers have the ability to reach new audiences, create new markets, and validate new categories. Their content usually ranks well in Google, and they influence purchase decisions.
Finding the right influencers can be difficult these day,s but here are four data points you can measure against:
- Reach: How large is their community across all channels—blogs, contributed articles, bylines and social?
- Relevance: How often are they talking about the topics that are relevant to your business?
- Resonance: How does their content resonate with their audience, and does it result in engagement?
- Reference: Are they referenced or mentioned by other influencers?
Once you've identified the right influencers, it's smart to analyze their conversational patterns to identify the topics that are top of mind. You can cluster their conversations to uncover white space or track their conversations over time—similar to an audience analysis. You can also aggregate and analyze a group of influencers, or just look at one.
The following visualization represents trending conversational volume from a group of influencers over the last 12 months:
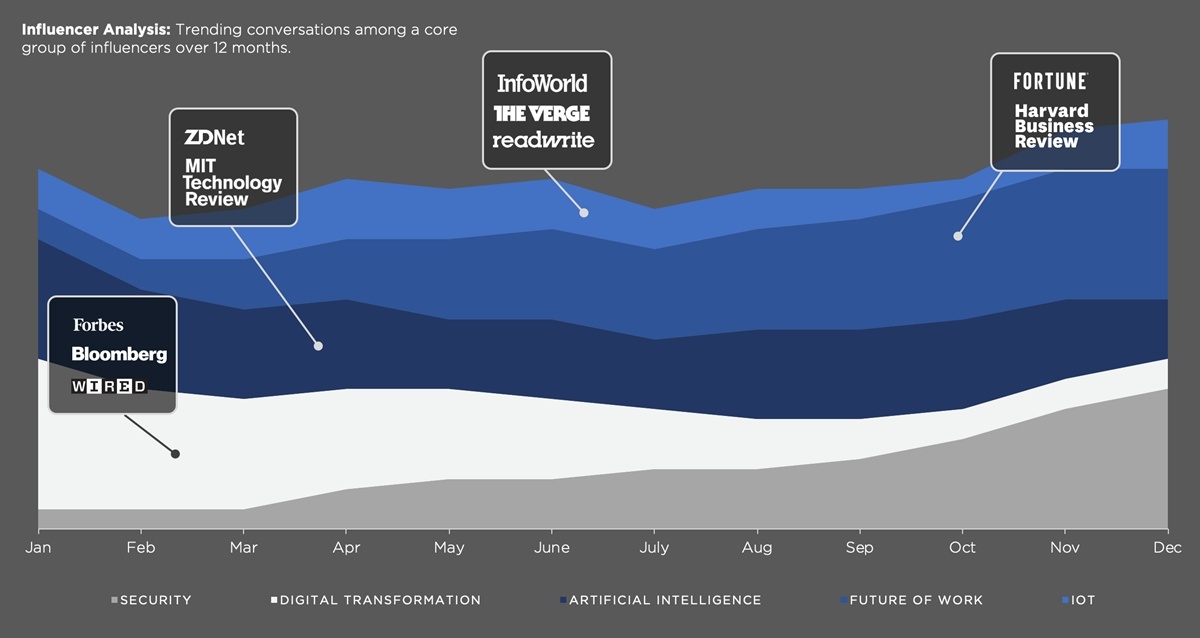
The data tells us that the topic of security and "future of work" increased in popularity, "digital transformation" decreased in popularity, and the topics like AI and IoT have remained flat. You can also see which media publications they have been referencing by their topic of interest.
Tracking this data can help understand which topics are most relevant to a group of influencers and which topics are declining. If you are trying to decide which influencers to work with, you can use similar data to see the impact they are making when they talk about these topics by correlating reach and engagement of their content.
The Media
There are various ways to analyze the media. You can analyze all media collectively by looking at all business and technology publications. Or, you can take a more granular look at 1, 5, 20, or more of the publications you want to prioritize. This approach requires scraping all the articles in the data set in order to find patterns and insights about the coverage and the topics most important to the media. The more they write about a topic, the more relevant it is to their editorial plan.
It's smart to cross-reference the volume of articles published about a topic with corresponding engagement and unique monthly visitors (UVMs) of that publication. Engagement is a social action (like, comment, share, tweet); it's evidence that content resonates with particular audiences.
The following visualization represents the media outlets that published the most content about artificial intelligence over the previous 12 months. The size of the circular plot represents the average unique monthly visitors of the media outlet. The X axis represents volume of content published; the Y axis equals the total engagement with that content.
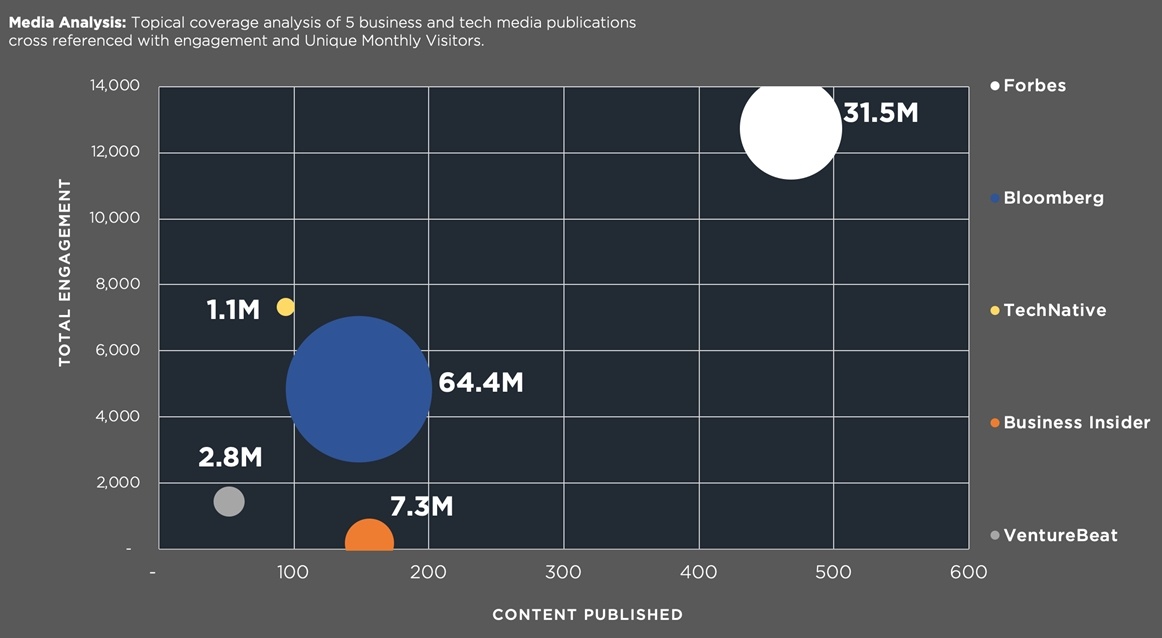
The data confirms that there is positive correlation between content published and total engagement. However, outliers like TechNative are actually generating more engagement with less content than larger, more established media outlets Bloomberg and Business Insider—though they may still offer brands more reach and awareness through higher monthly traffic.
This data gives a more accurate view of the landscape and will give clues as to which media owns a specific narrative and is making an impact with what they are publishing.
The data can also help prioritize a media relations strategy, sponsored content, or direct a media buy.
What's Next?
There are two things to remember before exploring the supply and demand of your audience.
The first thing to do is prioritize which audience you want to study and analyze. This means you'll have to determine whom you want to be relevant to, because each audience has different values and points of interest.
Second, data without an insight is just a number. In addition to the type of data analysis highlighted in this article, you'll have to layer on human analysis in order to and uncover layers of insight—and white space. It takes more time, but it's well worth it.