Despite the tough economic environment and unprecedented challenges to the industry, consumers' use of digital media climbed to new heights in 2009 as the Internet continued to evolve as an integral component of Americans' personal and professional lives, according to data from comScore.
Below, findings from the comScore 2009 US Digital Year in Review, which summarizes recent digital marketing trends and discusses implications for 2010.
Search: Google and Bing Led Market Share Growth
The introduction of Bing in June 2009 enabled Microsoft to gain renewed traction in the search marketplace: During the course of the year, Microsoft Sites grew from 8.3% to 10.7% share of all search queries, with nearly all of the growth coming in the second half of 2009, subsequent to Bing's introduction.
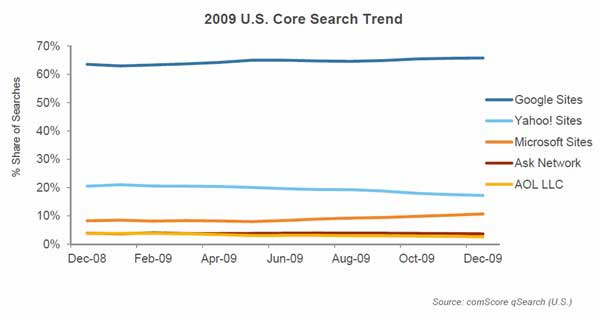
However, despite the new engine's initial gains, Google Sites continued to hold a strong lead in the US search market, accounting for 65.7% of all searches in December, up 2.2 percentage points from a year earlier.
The US core search market grew 16% in 2009, driven by gains in the number of unique searchers (6%) and search queries per searcher (10%).
- Google Sites' search query volume grew 21%, driven both by gains in searches per searcher (up 10%) and unique searchers (9%).
- Microsoft Sites had the largest growth in search volume (49%), propelled by gains in both unique searchers (15%) and searches per searcher (30%).
- Ask Network's search query volume grew 12%, driven mainly by attracting more searchers (up 19%).
Social Networking: Facebook and Twitter Surge, MySpace Refocuses on Entertainment
Social networking continued to gain momentum in 2009, with nearly four out of five Internet users visiting a social networking site on a monthly basis, and Facebook and Twitter propelling much of the growth in the category.
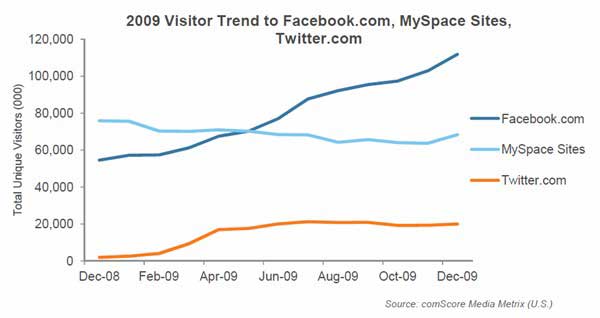
- Facebook surged to the No. 1 position among social networks for the first time in May and continued its strong growth trajectory throughout the year, finishing with 112 million visitors in December 2009, up 105% for the year.
- Twitter finished the year with nearly 20 million visitors to its website, up from just 2 million visitors the previous year. Much of Twitter's audience growth occurred during the first few months of 2009, at one point jumping from 4 million visitors to 17 million (between February and April).
- Although the 2008 category leader MySpace experienced some declines in audience, a new strategic focus on entertainment content achieved some success: MySpace Music increasing 92% percent during the year.
Meanwhile, MySpace's user composition shifted toward younger audience segments in 2009; people age 24 and younger now comprise 44.4% of the site's audience, up more than 7 percentage points from the previous year.
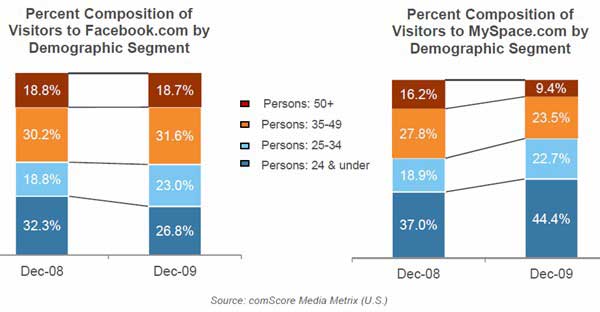
Facebook's audience, by contrast, was evenly split between those younger and older than age 35. The most noticeable demographic shift on Facebook during the year occurred among adults age 25-34, who now account for 23% of the audience, up from 18.8% last year.
Looking for real, hard data that can help you match social media tools and tactics to your marketing goals? The State of Social Media Marketing, a 240-page original research report from MarketingProfs, gives you the inside scoop on how 5,140 marketing pros are using social media to create winning campaigns, measure ROI, and reach audiences in new and exciting ways.
Twitter's Demographic Composition
All demographic segments of Twitter users recorded substantial gains, but certain segments grew more rapidly than others.
The initial success of Twitter was largely driven by users age 25-54, who comprised 65% of all visitors to the site in December 2008, with those age 18-24 accounting for just 9%.
Despite Twitter's initially older skew, as it gained widespread popularity with the help of celebrity Tweeters and mainstream media coverage younger users flooded to the site in large numbers during the year, with those under age 18 (up 6.2 percentage points) and those age 18-24 (up 7.9 percentage points) the fastest-growing demographic segments.
E-commerce: 2009 Marks First Year on Record of Declining Growth Rates
Total US e-commerce spending reached $209.6 billion in 2009, down 2% from 2008, and the first year on record with negative growth rates. Travel e-commerce spending dropped 5% to $79.8 billion, while retail (non-travel) e-commerce spending remained virtually flat at $129.8 billion.
Throughout most of the decade, e-commerce spending registered growth rates in excess of 20% annually, but in 2008 signs of softness were evident as the economy first began to weaken. Nevertheless, 2008 annual e-commerce spending grew 6% over 2007 levels.
However, in 2009 year-over-year growth rates remained negative throughout most of the year.
Heaviest E-tail Online Spending Days
The heaviest individual spending day of the year was Tuesday, Dec. 15 ($913 million), the first day on record to eclipse the $900 million spending threshold.
Cyber Monday (Nov. 30, 2009) was the second heaviest spending day, at $887 million, followed by Dec. 1 at $886 million, and Dec. 16 at $874 million.

Display Ad Impressions Increase 21% in 2009
US Internet users viewed a total of 4.3 trillion display ads (standard and nonstandard IAB ads, including both static and rich media, but not video) during the past year, up 21% from 2008.
Growth was driven by increases in ad reach (8%) and average frequency (12%).
The top 10 US online display advertisers during the year, ranked by number of impressions, included the following:
- AT&T Inc: 84.3 billion ad impressions
- Verizon: 56.8 billion
- Experian Interactive (includes ClassesUSA, LowerMyBills, and FreeCreditReport): 54.1 billion
- Scottrade: 41.1 billion
- eBay: 32.3 billion
On the publisher side, Yahoo Sites served the most display ads in 2009 (521.2 billion), followed by Fox Interactive Media (which includes MySpace) with 367.6 billion, and Facebook with 329.6 billion.
Online Video: US Market Soars
Online video viewing accelerated in 2009, with 19% more people in the US viewing more videos for longer periods of time.
In December 2009, 86% of the total US online population viewed video content. Americans also viewed a significantly higher number of videos during the year, due to both increased content consumption and a growing number of video ads' being delivered.
Viewers watched on average 187 videos in December 2009 (up 95% from 2008), while the average duration of the videos viewed grew from 3.2 to 4.1 minutes.
- Youtube accounted for 26% of total time spent viewing video, more than the combined time spent of video content sites ranked between No. 2 and No. 25 (22%).
- Hulu viewers watched more than 1 billion streams for a combined 5.8 billion minutes (97 million hours), up 140% from a year ago. Hulu viewers watched on average more than 2 hours of online video during the month.
Meanwhile, 52% of online viewing occurred at video sites ranked outside the top 25, suggesting the increased fragmentation of online video and the emergence of sites in the "long tail."
Mobile: Smartphone Penetration Rises in 2009
In 2009, smartphone ownership increased from 11% to 17% of mobile users, while 3G phone ownership increased from 32% to 43%. Among the high-profile smartphone introductions were the Palm Pre, Motorola Droid, and Motorola Cliq.
Among smartphone operating system (OS) platforms, RIM retained its lead with 41.6% market share, followed by Apple at 25.3% (up 8.5 percentage points from the previous year), and Microsoft at 17.9%. Google's OS share (5.2%) gained considerably in the final months of 2009; it is poised for continued growth in 2010 with the introduction of new devices featuring the Android platform.
The largest four mobile network providers––Verizon, AT&T, Sprint, and T-Mobile––combined accounted for 80% of the entire US mobile subscriber market in December 2009. Verizon was the largest service provider in the US with a market share of 31.2%, followed by AT&T (25.0%), Sprint (12.1%), and T-Mobile (12.1%).
About the data: Findings are from the comScore 2009 US Digital Year in Review.


