Data from mixed-mode questions are hard, if not impossible, to interpret accurately.
The first part of this article will give an example of a mixed-mode question and an analysis of how to interpret the results that such as question would produce. As you will see, mixed-mode questions, or scales, should be avoided.
The second part of this article will explore the problem of mixed-mode scales further and use the example from the first part to point out issues related to interpreting the data. We then find a solution to the original, flawed approach.
Mixed-Mode Scales—The Problem
Let's look at an example of a mixed-mode question and the problems interpreting the results that such a mixed-mode scale would produce.
Notice how the mixed mode, or double concept, appears workable but quickly gets the researcher into trouble when it's time to understand the results.
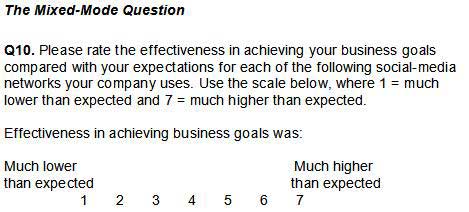
(Note: The items to be rated are not necessary to the example. Feel free to fill in your own.)
You may already see the problem, but allow me to describe it.
A respondent could score the "effectiveness" for an item "higher than expected," but that person's starting expectation might have been low; or a respondent could score "effectiveness" for an item "lower than expected," but that person's starting expectation might have been high.
The data are nearly impossible to interpret without knowledge of the respondents' original expectation levels.
To clarify, let's look at four extreme scenarios:
- All the respondents start with low expectations, and their response for effectiveness in achieving business goals was 1—much lower than expected.
What would be your interpretation? - All the respondents start with high expectations, and their response for effectiveness was 1—much lower than expected.
What would be your interpretation? - All the respondents start with low expectations, and their response for effectiveness was 7—much higher than expected.
What would be your interpretation? - All the respondents start with high expectations, and their response for effectiveness was 7—much higher than expected.
What would be your interpretation?
Scenario Analysis
Now let's examine each scenario and compare the interpretations that logically follow based on the extreme cases previously outlined.
- In scenario No. 1, respondents start out with low expectations, and their experience is lower still. Wow! What does that say? Social media was not expected to do much, and it did even less!
- In scenario No. 2, respondents start out with high expectations, and their experience is lower than expected. Well, perhaps their original expectations were unrealistically high! That tells us something entirely different from the first scenario.
- In scenario No. 3, respondents start out with low expectations, and they experience higher value than expected. OK, good, but it probably was not hard to meet or exceed the low bar they set, right?
- In scenario No. 4, respondents start out with high expectations, and they experience value higher than their already high expectations. Wow, now that's a winner! And, it's a very different interpretation from any of the other scenarios.
As you can see, mixed-mode questions should be avoided. In a forthcoming article, we will develop a research instrument to show how to fix that serious design flaw. The article will explore the relationship between effectiveness and expectations that you can accurately interpret.
Mixed-Mode Scales—The Fix
The first part of this article explored the problem of mixed-mode scales and used a specific example to point out the issues related to interpreting the data from such a problematic question.
The problem was that a respondent could score the "effectiveness" for an item related to social media as "higher than expected" with or "lower than expected," but without knowing the original expectation level for each respondent, we would be essentially unable to interpret the survey data.
As we discussed, the solution is to collect information on expectations separately—before asking about effectiveness.
Moreover, one could improve the data collection by providing a definition for effectiveness, which was not part of the previous discussion but would clearly be in order.
We start fixing the problem by presenting respondents with the following introduction to the questions:
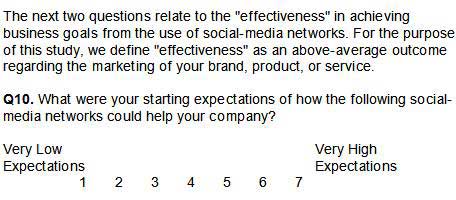
(Note: The items to be rated are not necessary to the example. Feel free to fill in your own.)
Now we can ask the original mixed-mode question that we posed:
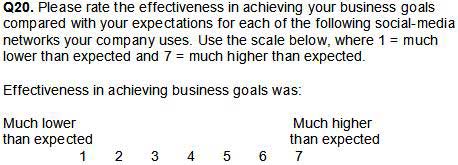
(Note: The items to be rated are the same as Q10.)
Solution Analysis
Now respondents are at least in the same ballpark in how they understand "effectiveness." (The definition is still a bit vague, but our goal is not to measure how respondents view effectiveness, although a study on that topic would be interesting.)
Moreover, we know whether the respondent had high or low expectations for each social-media network item we are testing, which will allow us to test the scenarios we outlined previously. Specifically, we can explore the following:
- What is the respondent's experience related to effectiveness if the respondent starts with low expectations? Is it lower still? If that is true, it suggests that social-media networks were not expected to do much and did even less!
- What if the respondent had low expectations and experienced higher value than expected? OK, good, but it probably was not hard to meet or exceed the low bar set, right? Nevertheless, the relationship between expectations and outcomes is clear.
- What about the respondent with high expectations who reports effectiveness as lower than expected? Well, perhaps the original expectations were unrealistically high. That tells us something entirely different from the analysis above.
- Finally, what about the respondent with high expectations whose experience related to effectiveness is higher than the already high expectations the respondent had? We have a winner! Moreover, it is a very different interpretation from any of the others.
The approach of using question combinations to explore the market (rather than shortcuts that yield poor and confusing data) provides a much richer set of data.
It is one of the many principles I discuss in my book, Questionnaire Design for Business Research. Mixed mode scales are one of the 30 quality-control items checked as part of our standard Questionnaire Audit service.