Most CEOs, CFOs, and financial analysts will tell you that revenue is a KPI (it's really not), second only to profit (which is also not a KPI).
They're wrong, and here's why.
When revenue is rising, it can hide problems in the business. Everyone likes it when revenue increases, and the general attitude is, "Revenue is going up, keep doing what you're doing!" But serious problems and oversights in your business can result.
One problem might be that you're generating more revenue in the form of higher sales from a smaller customer base, which is often linked to lower marketing expenditures (and thus higher profitability). The business can thus be at risk by the actions of a small number of customers.
Another problem might be that you're quickly generating revenue from new customers while revenue from returning customers is falling, indicating customer churn.
Examples of both situations abound in the marketplace.
When revenue is falling, it doesn't tell you why. If revenue is dropping, it can be a major signal that something is off, but falling numbers won't automatically tell you what's not working. Are you losing new customers? Are your current customers turning off? Is there a product miss? Are there operational problems?
In addition, employees focused on a falling revenue number will think, "OK, what do I do differently?" And that revenue number doesn't tell them anything. The revenue number measures the business results as a whole—not any individual functions.
Revenue tells you nothing about the most important component of your business: your customers. If given a revenue number for this period and last, those numbers tell you nothing about your customers. Did you gain active customers or lose? Did you add more new customers or did customers lapse at a faster rate? Are your customers more engaged with your business or less? Revenue answers none of those questions.
Revenue is an important measure. But revenue is a symptom of what's happening in your business, it's not a cause.
However, it is possible to derive some measures from revenue that can be KPIs.
Relating revenue to customers at a gross level looks like this:
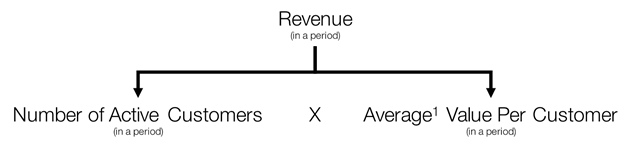
Revenue in a given period is the number of active customers in a period (active = generated revenue) multiplied by the average value per customer in that period. This is a very basic breakdown of revenue, yet these two components are better KPIs:
- If you're measuring the Number of Active Customers from period to period, it will tell you how many customers you are engaging with. Are you reaching more people? Are you losing customers? This KPI will at least give you an indication of whether this half of the revenue equation is helping or hurting.
- Average Value Per Customer can be a gross measure of how engaged active customers are with your brand and company. Is the value rising? It can indicate that customers are becoming more engaged with your company. Is the value falling? It might indicate that your products are less engaging to your customers or less engaging in relation to marketplace alternatives.
Both of those measures could be used as KPIs, and they are certainly better than revenue.
But we can do better:
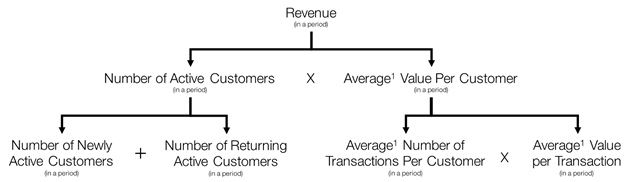
Now we have four measures that might be considered KPIs:
- Customer KPIs: Newly Active and Returning. By breaking down the number of active customers into new and returning, we can see the mix in our business of customer acquisition versus retention. Are we doing a good job in retaining past customers and keeping them coming back? Are we doing a good job in acquiring new customers? Are we balancing our business between the two, or are we churning through customers?
- Value KPIs: Transactions per Customer and Value per Transaction. By breaking down the value into transactions, we can begin to see how frequently customers are interacting with us, and what the value (in terms of revenue) is of those transactions. Are we increasing the frequency of transactions, or are we seeing an increase in the value of each transaction?
Even more important, at this level we can begin to see how KPIs might be broken down and assigned to different groups within an organization. Let's say that we have two marketing/sales groups: one focused on acquisition of new customers, and one focused on retention. Let's rearrange the diagram above a bit:
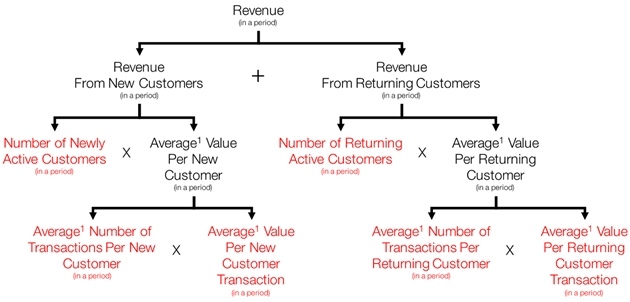
We now have six KPIs with which we can measure our two core marketing groups:
- The Acquisition Team, with key KPIs of the number of newly active customers, the number of transactions those new customers had during the period, and the value of those transactions.
- The Retention Team, with key KPIs of the number of returning customers, the number of transactions those returning customers had during the period and the value of those transactions.
These six KPIs can tell you a lot of about the health of your business, especially if visually depicted on a dashboard. They don't tell you everything, but they give you a good idea of where to look further to understand the reasons why revenue is rising or falling.
With a hierarchy of measures, we can see why revenue is not a good KPI. Revenue is an aggregate measure. Everything in black type in the third diagram is an aggregate measure, compiled from the measures below it. Everything on the bottom level, in red, is an individual KPI. The further up you go, the more aggregated the measure is and the less it will tell you about specific aspects of your business.
Because revenue is at the top, it gives you the least specific information. But just beneath its surface are measures that will allow you to keep tabs on the pulse of your business if evaluated regularly.
¹Remember that averages are mathematics, not people, and there's no such thing as an average customer. We at Elicit often say "Averages Are Evil." Look below the surface of an average, and you'll usually find new insights.