Similar to search engine results pages, being in the top two or three listings of a Facebook Graph Search results page is key to ensuring a listing is seen quickly and for a relatively long duration, according to research by Mediative, which used eye-tracking technology to explore which elements of the Facebook Graph search results page hold the most interest.
For the study, 21 people were asked to view the results of the query "restaurants nearby" on a given Facebook page. Among the participants, 95% focused on the top two results of a Facebook search results page—and the proportion of viewers who viewed a given result decreased fairly uniformly as viewers scanned down the page.
Graph Search was introduced in January 2013. It is a semantic search feature that allows users to execute a search queries directly in Facebook. Still in beta, the feature generates search results that incorporate the recommendations and likes of people in a given network.
Along with News Feed and Timeline, Facebook views Graph Search as the third pillar of the social networking site.
Below, additional findings from Mediative.
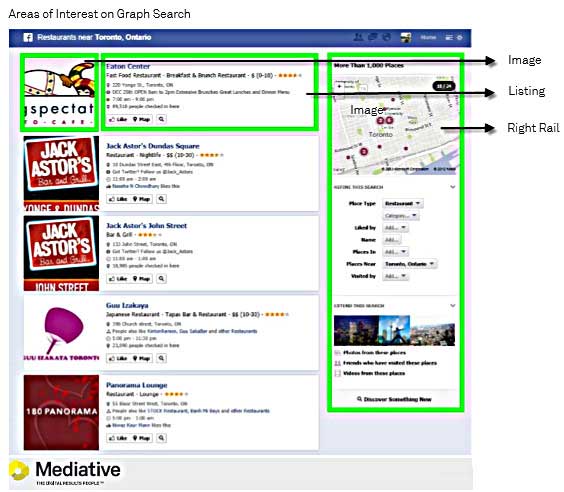
The study focused on key "areas of interest," consisting of the 12 results visible on the Facebook Graph results page, split into three sub-areas: Image, listing, and right rail:
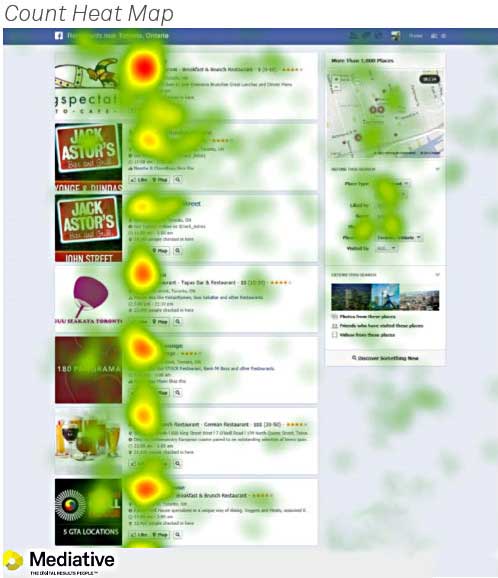
Based on the results of eye-tracking technology, the count heat map (below) shows the amount of views that the three areas of interest garnered. The red areas are those that had the most views, followed by yellow and green.
Not surprisingly, viewers scanned the text listings in the order of their appearance, with more viewers generally looking at a listing than the accompanying image.
Unlike the viewing habits of search engine users, there was not much horizontal scanning, which typically happens on a Google search results page.
That’s likely because Search Graph results included business names only in the top line, whereas in results via search engines, where the horizontal scan is longer, additional descriptive text appears in the title.
The other contributing factor may be that Mediative's research centered on a search for restaurants in a geographic area that participants were already familiar with.
Some 95% of results-page viewers focused on the top two results, and the proportion of viewers who looked at a result decreased fairly uniformly viewers scanned down the page.
Moreover, the top text listing and the right rail were the areas of interest that captured the highest number of visits. On average, participants looked at the text listings 48% more than the accompanying image and spent 138% more time looking at the text listing than the accompanying image.
Time-to-First-Fixation
Time-to-first-fixation measures the time (in seconds) before the participant fixated on an area of interest. Not surprisingly, the top results were viewed faster than the lower results:
- On average, text listings captured attention 1.74 seconds faster than the images.
- Across the top two results, text listings were viewed almost three times faster (4.52 seconds) than the image.
- On the top half of the page (results 1-6), listings were viewed before images. It’s not until the seventh result that an image is viewed before the corresponding listing.
Visit Duration
Visit duration measures the amount of time (in seconds) someone spent fixating inside an area of interest before they look outside of it again, regardless of the number of fixations. Similarly, more time was spent looking at a text listing than the accompanying image:
- Average duration of a visit to a text listing was 0.18 seconds longer (55%) than a visit to an image.
- The right rail was the area of interest with the highest visit duration at 1.07 seconds, likely because there was more to see and because the feature was new to viewers, according to Mediative.
- Visit duration to the right rail was 152% longer than average visit duration to the results (listings and images).
About the data: Using eye-tracking technology, 21 participants of mixed age and gender completed a task on Graph Search in Mediative’s TiveTank research lab in Toronto.
Each participant was given the same task, and presented with the same Facebook page. Once a page element was clicked (for example, a result, the "Refine This Search" filter, the map, etc.) the test ended. One Facebook account was used to ensure that everyone was presented with the same results. The Task was "Imagine you’re looking for a restaurant in Toronto. You try Facebook's new local search engine and search for 'restaurants nearby.' You'll see the results on the next page. What would you do to find a restaurant for dinner tonight?"