The feud between iOS (Apple's mobile operating system) and the Android mobile operating system keeps heating up. To help marketers better understand the two biggest competitors in the "app arms race," Trademob created the following infographic.
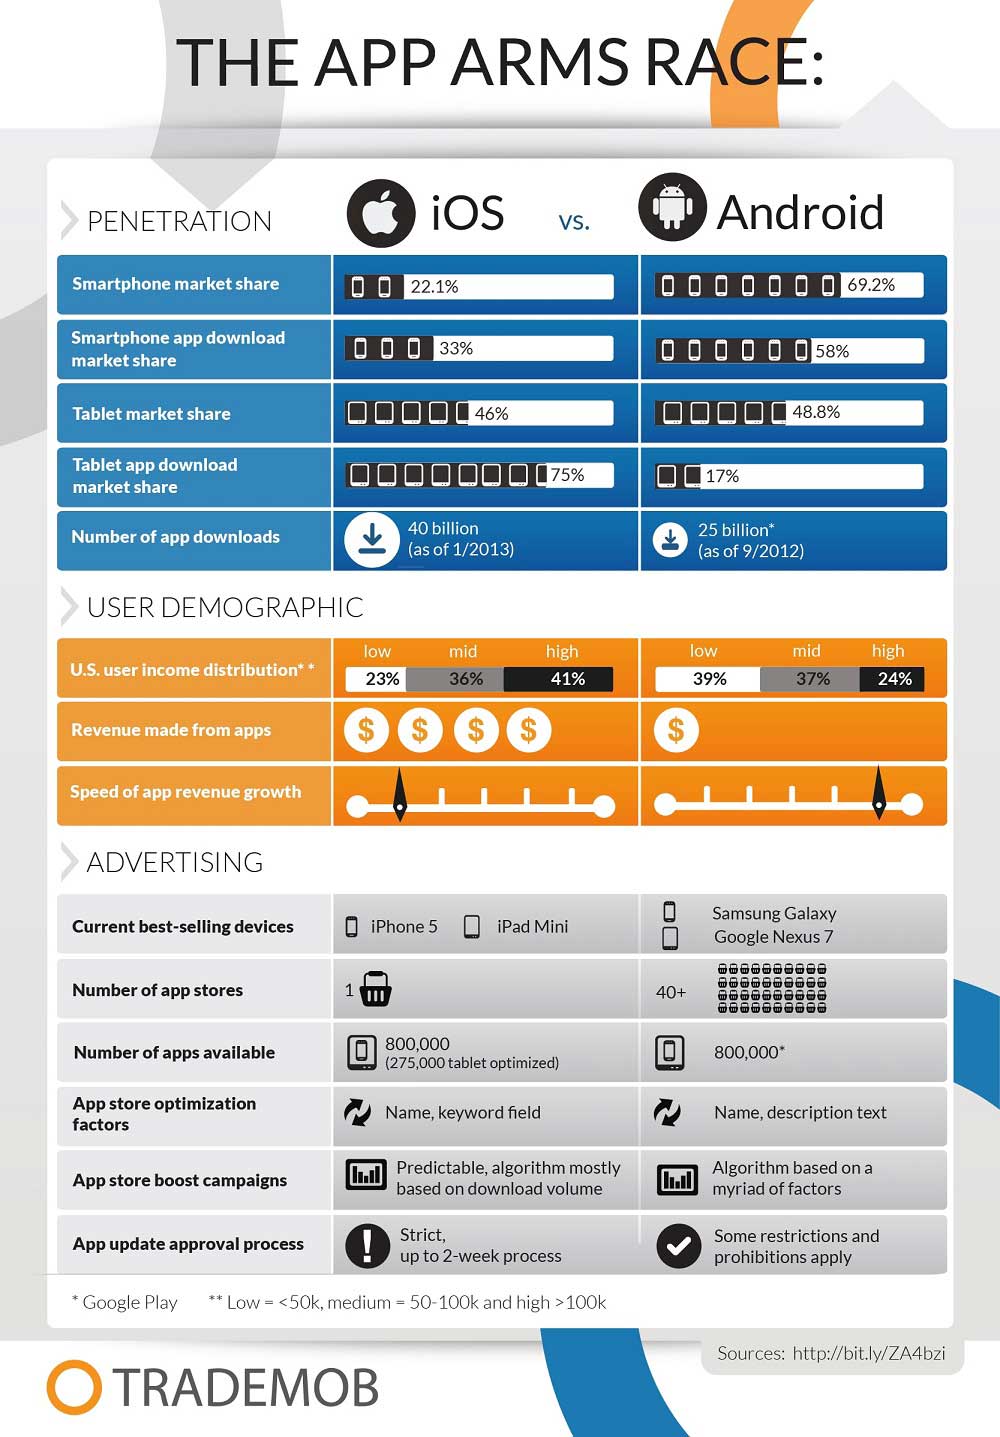
The infographic compares the market penetration, user demographics, and advertising related to iOS and Android.
Android dominates smartphone market share with 69.2% to iOS's 22.1%. Android also has a higher smartphone app download share (58%), compared with iOS's 33%.
The tablet market share is split almost evenly, with Android's at 48.8% and iOS's at 46%. However, considering tablet app download share, iOS dominates with 75% while Android accounts for only 17%.
So, do those stats mean marketers should focus on Android when making apps for smartphones, and on iOS when creating apps for tablets?
Not necessarily.
Marketers should also consider (among other factors not mentioned in the infographic) user demographics (such as user income distribution), revenue made from apps, and speed of app revenue growth, as well as current best-selling devices and number of apps available.
For more, check out the following infographic: