As marketers, we very often hear the term "Big Data." Thanks to the latest technologies, we are able to gather data about customers and prospects—and that data can provide a lot of answers. But it also raises a lot of questions.
An infographic by Villanova University’s Online Master of Science in Analytics degree program explains how marketers are using data to reach customers.
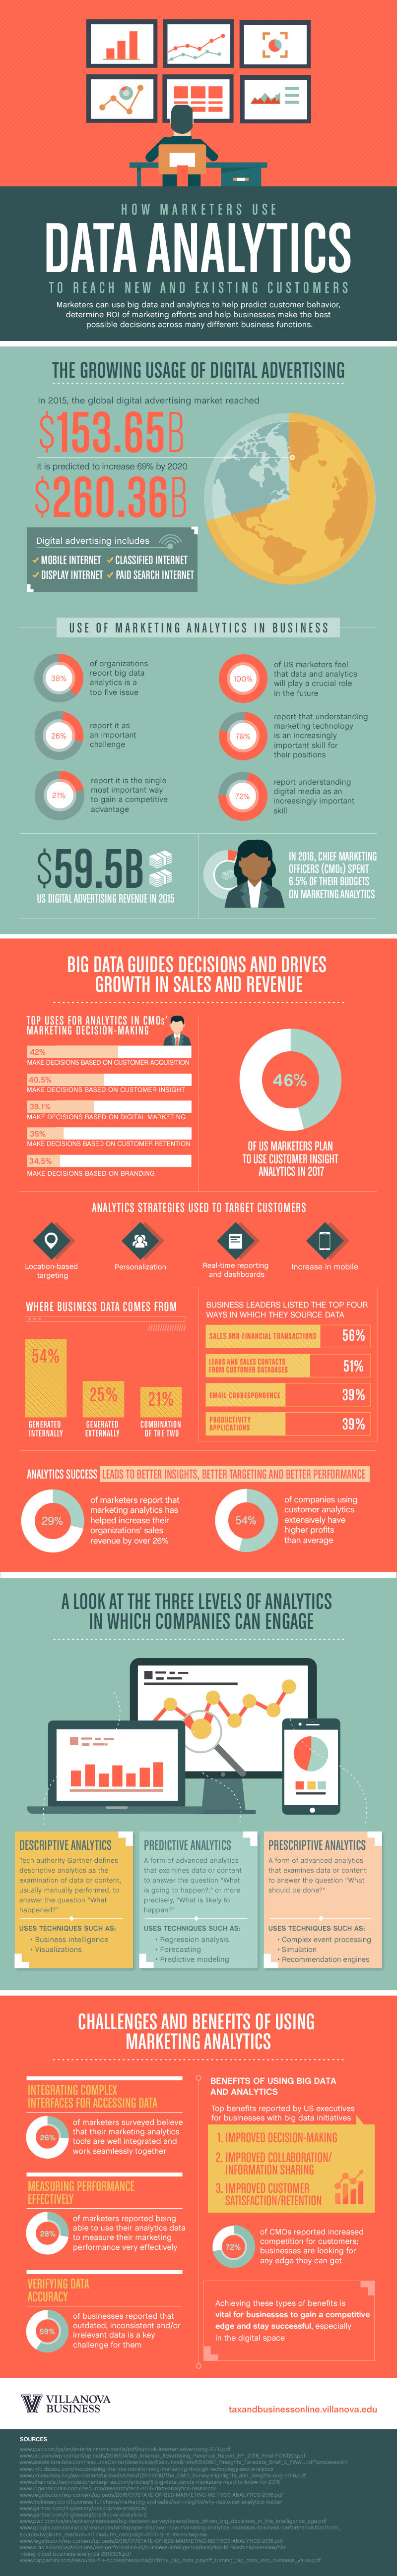
The infographic shows where their data is coming from, how companies are using it to drive decisions, and what some of the challenges are that come along with all this available information.
The graphic also breaks down the use of this data into three types of analytics:
- Descriptive: "What happened?"
- Predictive: "What is likely to happen?"
- Prescriptive: "What should be done?"
To learn more about how marketers use data analytics to reach new and existing customers, check out the full infographic. Tap or click to see a larger version.