The next time your boss asks you to work late, show her this: an infographic by CRM review site GetCRM that illustrates working hours versus productivity for various countries.
The correlation is pretty clear: The greater the hours worked per week, on average, the lower the productivity (calculated as follows: GDP per capita (total output of a country divided by the number of people there) divided by hours worked per week).
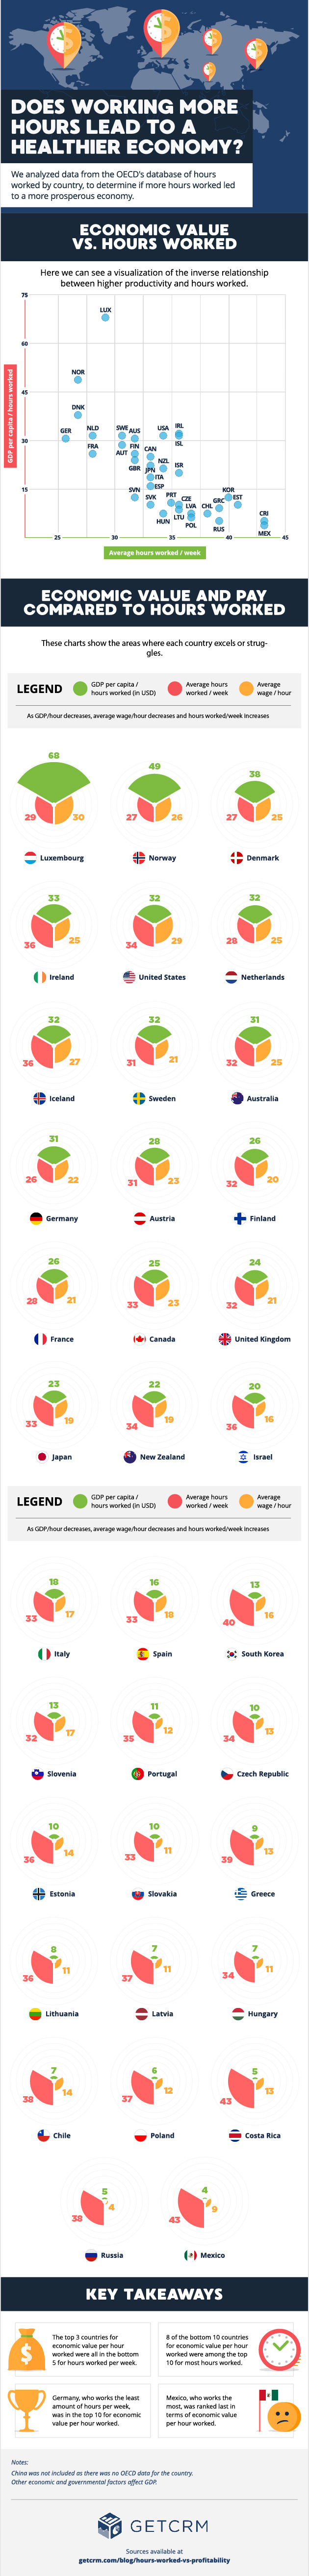
The graphic also shows which countries excel and struggle in certain areas. For example:
- Luxembourg is far ahead of the pack in per-capita GDP/hours worked; it's the most efficient of the countries included in the graphic.
- Russia and Mexico account for the highest hours worked per week, and their average wage earned per hour is among the lowest.
So what can we learn? The graphic offers some key takeaways, including this: "The top three countries for economic value per hour worked were all in the bottom five for hours worked per week."
To see where your country fits in this view of work and productivity, check out the infographic: