Blink a few times... and the 2019 holiday-shopping season will be here. Smart marketers and retailers have already started making plans to capitalize on the year's most lucrative shopping season.
If you haven't started yet (or even if you have), an infographic by customer journey optimization company Yieldify can help with your planning for this year's holidays.
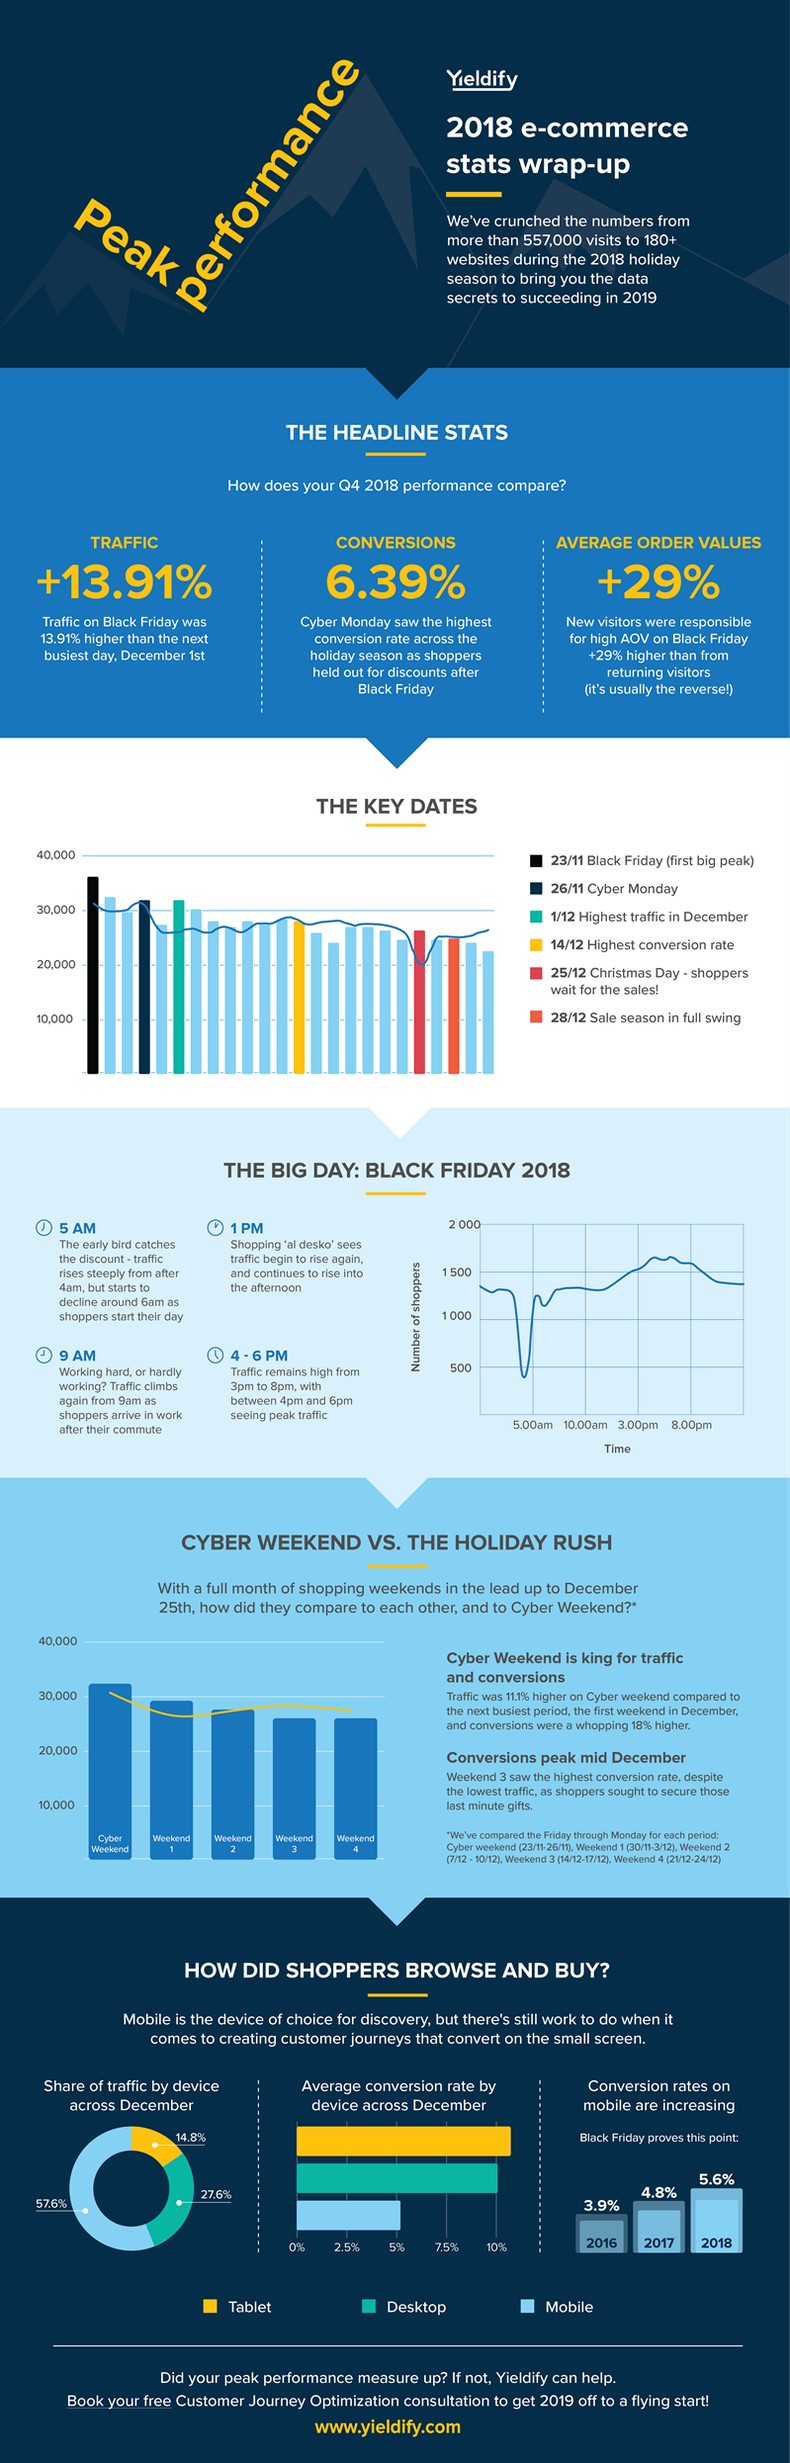
The infographic provides e-commerce stats and information on peak shopping times from the 2018 holiday-shopping season. For example:
- The highest traffic was on Black Friday, and it was 13.91% higher than the next busiest day, December 1.
- Cyber Monday had the highest conversion rate across the holiday season: 6.39%.
- 57.6% of shoppers used their phone to browse, with conversion rates rising to 5.6%.
The information is based on an analysis of over half a million visits in November and December to US and UK websites.
What was true in 2018 won't necessarily be true in 2019, but these stats are a great starting point for your holiday shopping-season planning. Check out the infographic for the data and the insights.