Every salesperson wants a healthy pipeline, but many don't have a reliable way to take its temperature. Beyond just "healthy" or "dry," what do you need to look at to truly gauge the health of a sales pipeline?
You definitely need to know the metrics of each stage of the pipeline and how they can be used to understand overall pipeline health.
By using hard numbers at every stage of the pipeline, salespeople are able to see not only where the bottlenecks are but also what's causing them.
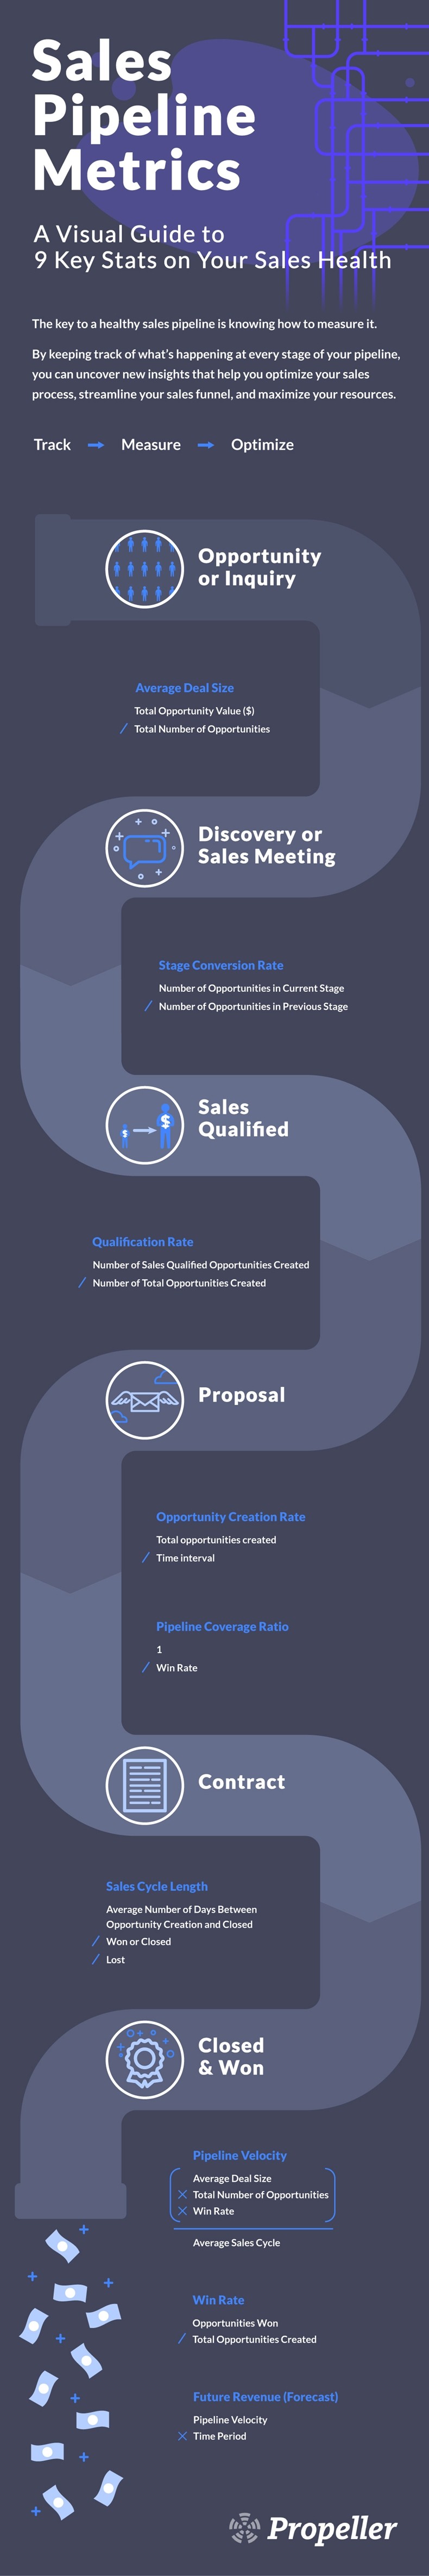
Sound useful? You can use the following nine key sales pipeline metrics—and their formulas—to uncover insights that help you optimize your sales process, streamline your sales funnel, and maximize your resources.
Check out the infographic by Gmail-based CRM solution Propeller (the company has shut down as of December 15, 2019).