Perceptual maps are the only way to understand what your position is in the market and how the market views you vs. your competitors. In fact, if you don't have a perceptual map, in essence you're flying blind.
It's therefore surprising that so few companies use perceptual maps to make decisions about their market efforts.
I've seen companies put together competitive intelligence in the form of battlecards (which are essentially a one-page visual aid comparing an organization's pricing, product, features, etc. to a competitor's) to understand how their product compares to a competitor products.
But that is not a view of how customers perceive your product versus the competition.
Insights From Perceptual Maps
Perceptual maps provide several insights to marketers:
- First, they show how close customers perceive your brand to be relative to competitors. If your brand and another brand are perceived to be similar on the benefits they provide, they are likely to be direct competitors.
For example, you may want to differentiate your brand from your closest competitor, particularly on a benefit that customers regard as important.
- Second, they will reveal any places where no competitor is currently competing, or where no competitor has competed successfully. Notably, such places may exist because no customers are interested in that combination of benefits.
- Finally, a perceptual map can also reveal how far away you are from being perceived as the best—that is, how far you are away from what we call the "nirvana point" that customers in the segment want.
Creating a Perceptual Map
The process of creating a perceptual map is relatively simple. Here is how you can start.
First, identify the benefits that comprise your market from a customer's viewpoint. Then, get benefit-related data from customers.
To get that data, ask a representative sample of customers to evaluate each brand on the extent to which each benefit is characteristic of each brand. It's best to use a response scale that lets customers assess how much each benefit is characteristic of the brand (for example, 1 = not at all; 7 = very much). Doing so allows you to see the differences between brands more clearly.
By comparing the mean benefit score of each brand in your market on each benefit, you should be able to come up with a perceptual map.
If you start with many benefits, ask yourself whether all are necessary. Some may be similar. For example, in hand lotion, smooth skin and soft skin benefits may be highly related. If they are, you might eliminate one (smooth skin) and assess the other (soft skin).
The following chart is a perceptual map using benefits. It was done for the home exercise equipment market, and we have 501 responses using a customer data panel. Depending on what you sell, customer panels might provide good data but a better way might be to use your own customers, customers in market, and even customers who chose other vendors.
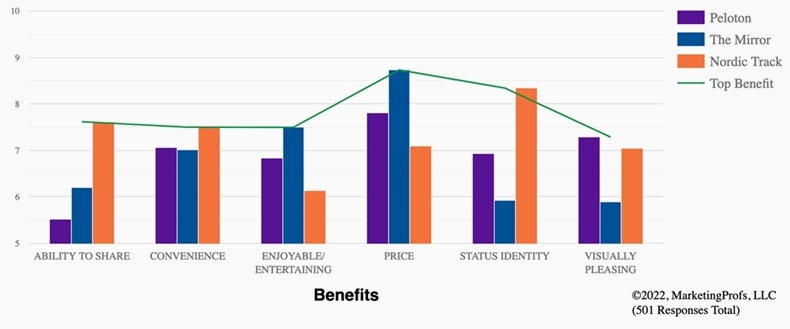
Notice that you can immediately see how customers view the different brands on the selected benefits. It you are one of these brands, you immediately know what you need to do to break out the pack.
Since most marketers don't use perceptual maps, just having a map is a distinct advantage over the competition.
Two-Dimensional Maps
Sometimes you might have to create the perceptual map using two dimensions. That will likely be the case if you don't use benefits but instead use features or a combination of features and benefits. If so, you will end up with large number of factors (features and benefits) and you will therefore need to reduce the factors to some more manageable level.
Also, some people just like to see the data plotted in two dimensions, despite losing a lot of information with that approach.
One way to reduce the data down to two dimensions is to submit the data to a principal component analysis (or some other a multidimensional scaling procedure) and then plot the brands in the resulting space. Here is an example of doing that with a beer market:
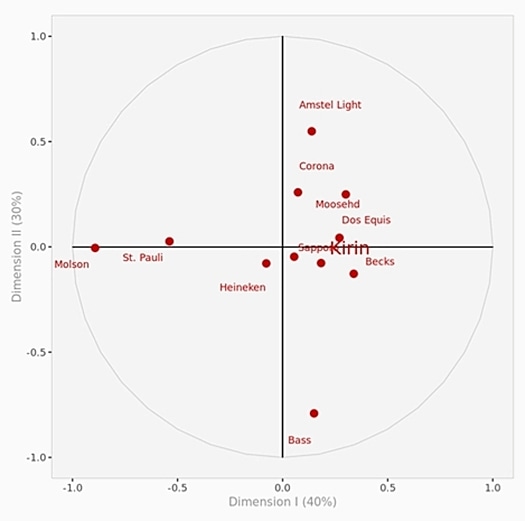
Produced by Enginius software, DecisionPro Inc.
A major problem with this approach is that you need to name the dimensions of this graph. That can be done with various techniques, including discriminant analysis and the like, but it will likely be a judgment call. That's because after you get the perceptual map in two dimensions, you will likely look at the map and come up what you believe are those two dimensions based on seeing how the various brands are plotted. But, if that's what you do, it's not from a customer's viewpoint, but your own.
Buyer Beware
You can find people online who say they can create perceptual maps for you—but buyer beware. They are not creating perceptual maps from real-customer data and they are hiding the shortcomings of a two-dimensional map.
In any event, perceptual maps allow you to see which benefits you might be able to beat the competition with. They will also allow you to see how to break out of a commodity market.
Gap Analysis
Once you have the map, determine which benefits you want to excel at.
I'm sure you think you excel at a lot of things, but if the information in the perceptual map is coming from real customers, it will show you what else you need to do to get to from where you are to where you want to be.
I call that gap analysis.
You can then work to close gaps between you and a competitor or between you and the best level possible.
The best level possible is indicated by the highest scale number that customers used to judge your brand and others. For example, in the Home Exercise Market, the highest possible number is 10. So, if you see your number is 8, that looks good. But you could push that to 10 if you want.
You close gaps by focusing directly on the benefits and determine what features and attributes about your product or service directly relate to that benefit; then make sure you clearly communicate that benefit in the market. Doing so is the only way to change customer perceptions.
Need Help With a Perceptual Map?
Perceptual maps are crucial to understanding your market. A map helps you find a way out of a commodity market, and it is essential for continued growth.
Need a little help with perceptual maps?
We realize this is not an easy task and we are here to help. Get in touch to see how we can help you to break out of a commodity market.
More Resources on Perceptual Mapping
Knowing How Your Competitors Are Positioned: The Key to Competitive Intelligence