Paid-search spending worldwide by US-based high-tech and consumer-electronics advertisers grew 16.6% in the fourth quarter of 2009 over third-quarter levels, after having grown 7.7% in the third quarter, according to a study from Covario.
Due in large part to a growing demand for ad space by consumer electronics companies during the holiday season, growth exceeded the 10% increase forecast by Covario in the previous quarter.
As advertisers continue to reinvest in paid-search advertising after a contracted first half of the year, spending is forecast to grow 14-18% in 2010.
Below, findings from the 2009 year-end edition of Covario's Global Search Spending Analysis, which examines paid-search spending by US-based global high-tech and consumer electronics firms.
The Rise of Bing
After the Yahoo-Bing deal in August 2009––whereby Yahoo agreed to standardize its technology on the Bing algorithm for both paid and organic search––spending on the network soared, doubling Bing's (MSN's) US market share from third quarter levels to 13.3% in the fourth quarter.
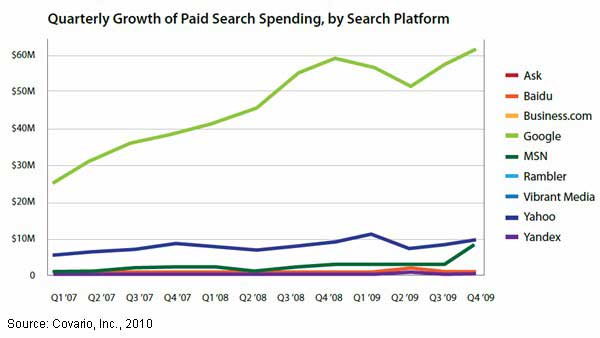
Fueled by a 158% in increase in 2009 search spending, Bing quintupled its market share in the US over the course of the year.
Google, which continues to dominate the search industry, recorded its lowest market share in the US in the three years of the study: 72%. Google also dominates foreign markets, particularly in the Europe, Middle East, and Africa (EMEA) region, where it recorded a 97% share in the high-tech sector.
Yahoo's growth this year was fueled by its advertising campaigns, which generated annual ad spending 36.5% higher than 2008 levels.
However, Yahoo's 2009 performance outside the US was weaker: Market share decreased 32.1% in the Asia-Pacific region, where its dominance is being challenged by Google, and its share in EMEA fell 74.6%.
Looking for solid, substantiated information about search engine marketing from the industry's best resources? The 84-page Search Engine Marketing Factbook featuring 55 charts provides data on who is using search engines and how, as well as data on keywords, clicks, and paid search metrics. This search-related factbook consists of chapters 1 & 3 from the larger Digital Marketing Factbook a 144-page compilation of data and 110 charts that also covers email marketing and social media.
Cost-per-Click Rising
With increases in search spending that occurred in the fourth quarter, cost-per-click (CPC) rates increased as expected, nearly 15%, during the same period.
In 2010, CPCs are forecast to climb 10-15%, driven by increases in spending on brand-building or generic terms, which are more expensive on a CPC basis.
Other 2009 CPC Findings:
- CPCs in the fourth quarter rose to $0.68 from $0.62 in the third quarter. In 2008, the average CPC was $1.04—and $1.19 in 2007. Prices are roughly 40% of where they were two years ago for same keywords.
- Yahoo's Dynamic Pricing program continues to drive large improvements in CPC for advertisers. Average CPC in the second half of 2009, since the service launched, is down 20–25%, making the clicks more affordable on the network.
- Bing CPCs increased the most in the fourth quarter (to $0.72 from $0.41 from the previous quarter) due to the large increase in spending on the network driving prices higher.
Cost of Search Platforms
Google is the most price-effective search platform, according to Covario's Acquisition Cost Index (ACI), which shows the relative cost per acquisition for the major search engines in the US:
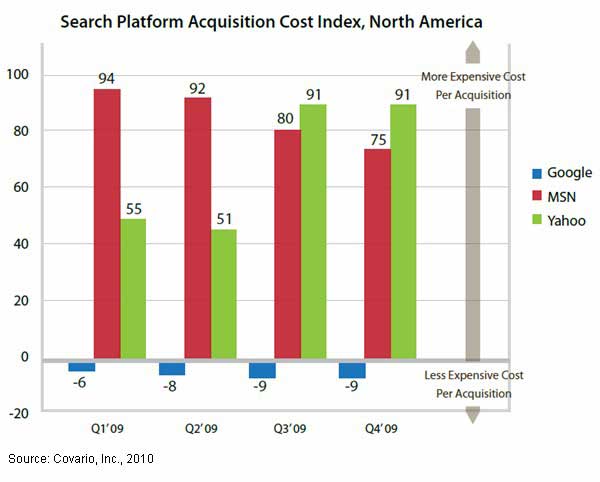
- Google's average cost per acquisition is 9% below the market average in the fourth quarter. (This means that if the average cost of customer acquisition across all of paid search is $1 for a particular advertiser, then acquisitions on Google are $0.93.)
- Bing has an average cost per acquisition that's 75% higher than the industry average for a consistent set of conversion events measured across the high-tech industry. The ACI on Bing has been improving since the first quarter when the cost was 94% higher than the industry average.
- Yahoo has been more expensive for advertisers throughout the year. In the first quarter, the ACI was 55% higher than the industry average and reached 91% by the fourth quarter.
About the data: The Covario Global Paid Search Spend Analysis is based on paid-search spending from US-based high-tech and consumer-electronics advertisers, and spans Q1 2007 through Q4 2009.


