Ad campaigns that target consumers on the basis of their social media activities and interest-based connections—or Brand Graph—perform better than ads without such targeting capabilities, and they generate large gains in brand lift and key direct-response metrics, according to a study by 33Across.
The new study, which showcases Brand Graph technology from 33Across, demonstrates how brands can boost the performance of advertising and direct marketing by targeting consumers based on their social media activities.
What Is a Brand Graph?
Comprising a vast set of digital, social, and demographic attributes, the Brand Graph is driven by an algorithm that predicts audience scale, loyalty, and purchase behaviors.
Unique to an industry, brand, or product, a Brand Graph essentially constructs a real-time network of people who, based on their social connections, are predicted to be loyal to a brand. A company's Brand Graph exceeds the audience size of its existing brand loyalists by 20 times, on average, according to 33Across.
Below, additional findings from the 33Across study, which examines Brand Graph marketing performance for the third and fourth quarters of 2011.
Among campaigns conducted in all industries during the third and fourth quarters of 2011, brands that served ads to people in their respective Brand Graph generated brand lift* ranging from 15% to 77% over advertisers' campaign goals; those same campaigns registered gains across key direct-response metrics ranging from 20% to 151%.
Brands were also able to predict groups of new consumers likely to become brand loyal; such groups, or predicted brand loyalists, were 7 to 30 times larger than their existing audience segments.
Performance Varies by Industry
Ad performance and audience expansion results varied across the five industry categories studied (auto, financial services, entertainment, CPG, and retail).
For example, during the study period, campaigns conducted in the retail sector registered brand lift of 56% (which, in the retail category, refer to gains in awareness), a 240% bump in return-on-ad spend, and a 53% improvement on cost acquisition goals.
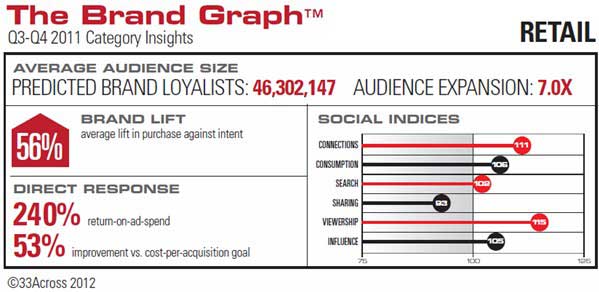
Industry-specific social indices provide key insights into the digital and social behaviors of the target segment: Consumers in the retail category are heavy video viewers, indexing at 115, or 15 points over the benchmark in viewership. Retail consumers are also very influential in their social networks, indexing at 111 in social connections.
Based on those characteristics, as well as frequent search habits, retail marketers are recommended to reach such consumers with video and search-driven display, according to 33Across.
In addition, the Retail Brand Graph predicts audience expansion of 7.0 times (over existing audience segment), amounting to more than 46.3 million in predicted brand loyalists.
Among findings related to other industry categories, issued by 33Across:
- People in the automotive category are among the most socially connected and are very influential in their online circles. They are also avid video viewers and like to search frequently, but index low for sharing (86, or 14 points below the benchmark).
- Entertainment had the highest overall brand lift (up 77%) of any category. As none might expect, such consumers are very active video viewers, well-connected socially, and have a strong presence in the blogosphere.
- Financial Services consumers share a considerable amount of content with their many social connections, indexing at 113 in social connections. Financial services consumers also score high in blog consumption.
- Consumers within the CPG Brand Graphs index high in online search (103) and sharing (109), the highest levels of any category.
Read the full five-industry report from 33Across.
*The metrics used to define "brand lift" vary by industry category. For example, in the CPG category, lift refers to purchase intent; in entertainment, lift refers to tune in; and in retail lift refers to exposure, or awareness.
About the data: Findings are based on data from 100 advertiser clients of 33Across and more than 250 campaigns, during the third and fourth quarters of 2011.


