As paid video content becomes more available via different channels, tablet and wireless phone viewing of paid video has increased from 2011 levels, while viewing via PC/Mac has decreased, according to the J.D. Power and Associates 2012 US Residential Pay-to-View Study.
The study, now in its second year, provides insights into attitudes, viewing preferences, behavior patterns, awareness, and experiences among pay-to-view customers of the major home television and video service providers in the US.
Among the findings:
- Overall, 29% of video service customers watch paid video content via handheld device.
- Some 18% of customers use tablets for viewing paid video content, making them the most-often-used handheld device, up from 11% in 2011.
- The use of wireless phone customers has increased to 16% in 2012, up from 14% a year earlier.
- Viewing of paid content via desktop and laptop (PC/Mac) has declined to 39%, down from 48% in 2011.
"Customers are becoming more comfortable viewing their paid content on a smaller screen...The convenience of the device, as well as the availability of the content, has made it much easier to experience video on a variety of devices," said Frank Perazzini, director of telecommunications at J.D. Power and Associates.
"However, the desire to watch events and video content as it happens is still prevalent, as more than 50% of viewers watch live television programming," Prazzini said.
Overall satisfaction with pay-to-view video service providers averages 750 (on a 1,000-point scale), up from 743 in 2011.
Below, additional findings from the study.
Generation Gap
The study finds a stark difference in the use and viewing practices of paid content among Gen-Y and Baby Boomer* customers, yet it finds only a minor difference in their satisfaction levels.
Use levels by device type differ among Gen-Y and Baby Boomer customers:

Moreover, when selecting a video service provider, 21% of Gen-Y customers consider mobility a factor, compared with only 9% of Baby Boomer customers, highlighting different needs between the two generations, according to the study.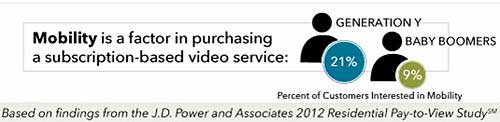
Also, satisfaction with video service providers among Gen-Y customers has declined to 752, down 18 points from 2011, while satisfaction among Baby Boomer customers is 748, an increase of 19 points from 2011.
Among Gen-Y customers, satisfaction has declined in part due to lower ratings for cost of service and customer service, while satisfaction among Baby Boomer customers has increased due to higher ratings for billing, ease of use, and variety of videos and programming available.
"Baby Boomers are more becoming more comfortable with paid video technology and, as a result, are becoming more satisfied with the services available," said Perazzini. "Conversely, Gen Y customers are already familiar with the technology and not only demand a high level of service from video service providers, but also are quick to seek alternatives when they believe they could have a better experience elsewhere."
Customers Spend More Time With Gaming Consoles
Nearly one-fourth (23%) of customers view paid content via gaming consoles, compared with those who view paid content via handheld devices (29%).
However, customers who view content on a gaming console watch 6.3 hours per week, compared with 5.3 hours on a PC/Mac, 4.9 hours on a wireless phone, 4.5 hours on a music player, and 4.4 hours on a tablet.
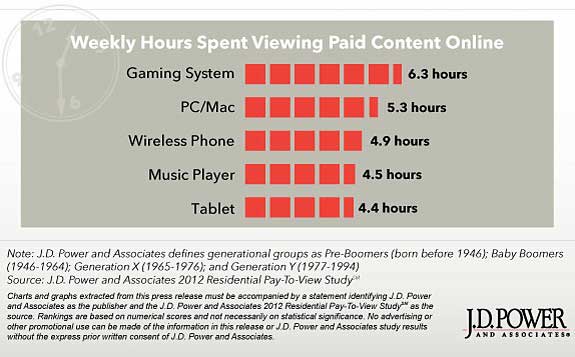
"These findings illustrate that while customers appreciate the convenience and value that gaming consoles provide, the TV screen is still a preferred viewing media," said Perazzini. "On the other hand, average viewing times for mobile devices and computers are likely impacted by battery life and screen [quality]."
*J.D. Power and Associates defines generational groups as Pre-Boomers (born before 1946); Baby Boomers (1946-1964); Generation X (1965-1976); and Generation Y (1977-1994).
About the data: The 2012 US Residential Pay-to-View Study is based on responses from 4,097 US households that evaluated video service providers, including Amazon, Apple TV, Blockbuster/Blockbuster Express, Google TV, Hulu/Hulu Plus, Local Video Stores, Netflix and Redbox. The study was fielded in April 2012. J.D. Power and Associates is a business unit of The McGraw-Hill Companies.


