The average order value (AOV) of smartphone traffic to online retailer websites reached $97.39 in the second quarter of 2012, higher than that of tablets ($96.11) and traditional devices ($91.86), according to a report by Monetate, which analyzed a random sample of more than 100 million online shopping experiences for the quarter.
The reported second-quarter smartphone AOV ($97.39) was down from the $104.96 recorded in the previous quarter. By contrast, tablets recorded a comparatively smaller quarterly drop in AOV, from $96.83 in 1Q12, to $96.11 in 2Q12.
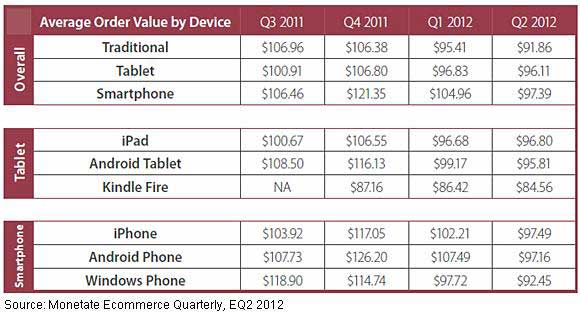
In the smartphone category, iPhone users spent more money when shopping via their devices. iPhone traffic to retail websites recorded an AOV of $97.49, beating out both Android ($97.16) and Windows ($92.45) smartphones. That's the first quarter since 3Q11 that iPhone users have recorded the highest AOVs.
In the tablet category, iPad traffic generated an AOV of $96.80, compared with $95.81 for Android tablets and $84.56 for the Kindle fire.
As for traditional devices, the AOV for Mac ($102.83) far outperformed Windows ($88.75) and Linux ($84.91).
Below, additional findings from Monetate's "Ecommerce Quarterly EQ2 2012" report.
Share of Traffic Retail Sites
Smartphones and tablets continued to account for a growing share of traffic to retail websites:
- Traditional devices accounted for the largest share (83.92%) of traffic to retail sites in the second quarter, down from 87.82 in 1Q12, and 93.47 in 2Q11.
- Smartphones accounted for 8.84% of traffic in the second quarter, up from 6.06% in 1Q12, and 4.27% in Q2 2011.
- Tablets accounted for 7.24% of traffic in the second quarter, up from 6.12% 1Q12, and 2.26% in 2Q11.
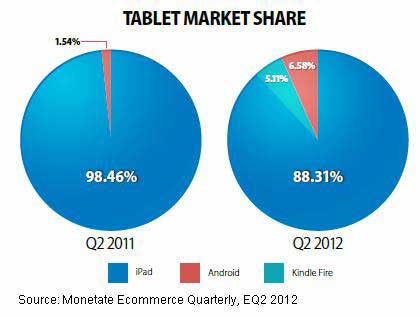
iPad Share of Traffic Declining
In only one year, Amazon and Google picked up 10% of the tablet market. The iPad's share of traffic fell to 88.31 in the second quarter of 2012, down from 98.46% a year earlier. Android accounted for 6.58% in the second quarter, and Kindle Fire accounted for 5.31%:
Other key findings from 2Q12:
- Smartphone conversion rates (1.09%) were far lower than for tablet (3.17%) and traditional (3.34%) devices.
- Android tablets (3.58%) had the highest conversion rate, slightly above the iPad (3.19%). Both outpaced the Kindle Fire (2.22%).
- Shoppers via Android-powered phones (1.26%) converted best of all smartphones, ahead of shoppers on Windows phones (1.02%) and the iPhone (1%).
- The iPhone accounted for 61.19% of smartphone traffic, up from 56.82% in 1Q12. Android's share of smartphone traffic dropped to 37.46%, from 41.82% the previous quarter, and down from a high of 46.14% in Q4 2011.
- The iPhone delivered 5.41% of total website traffic, up from 3.44% in 1Q12.
About the data: Findings are based on the analysis of a random sample of more than 100 million online shopping experiences using same-store data across each calendar quarter.


