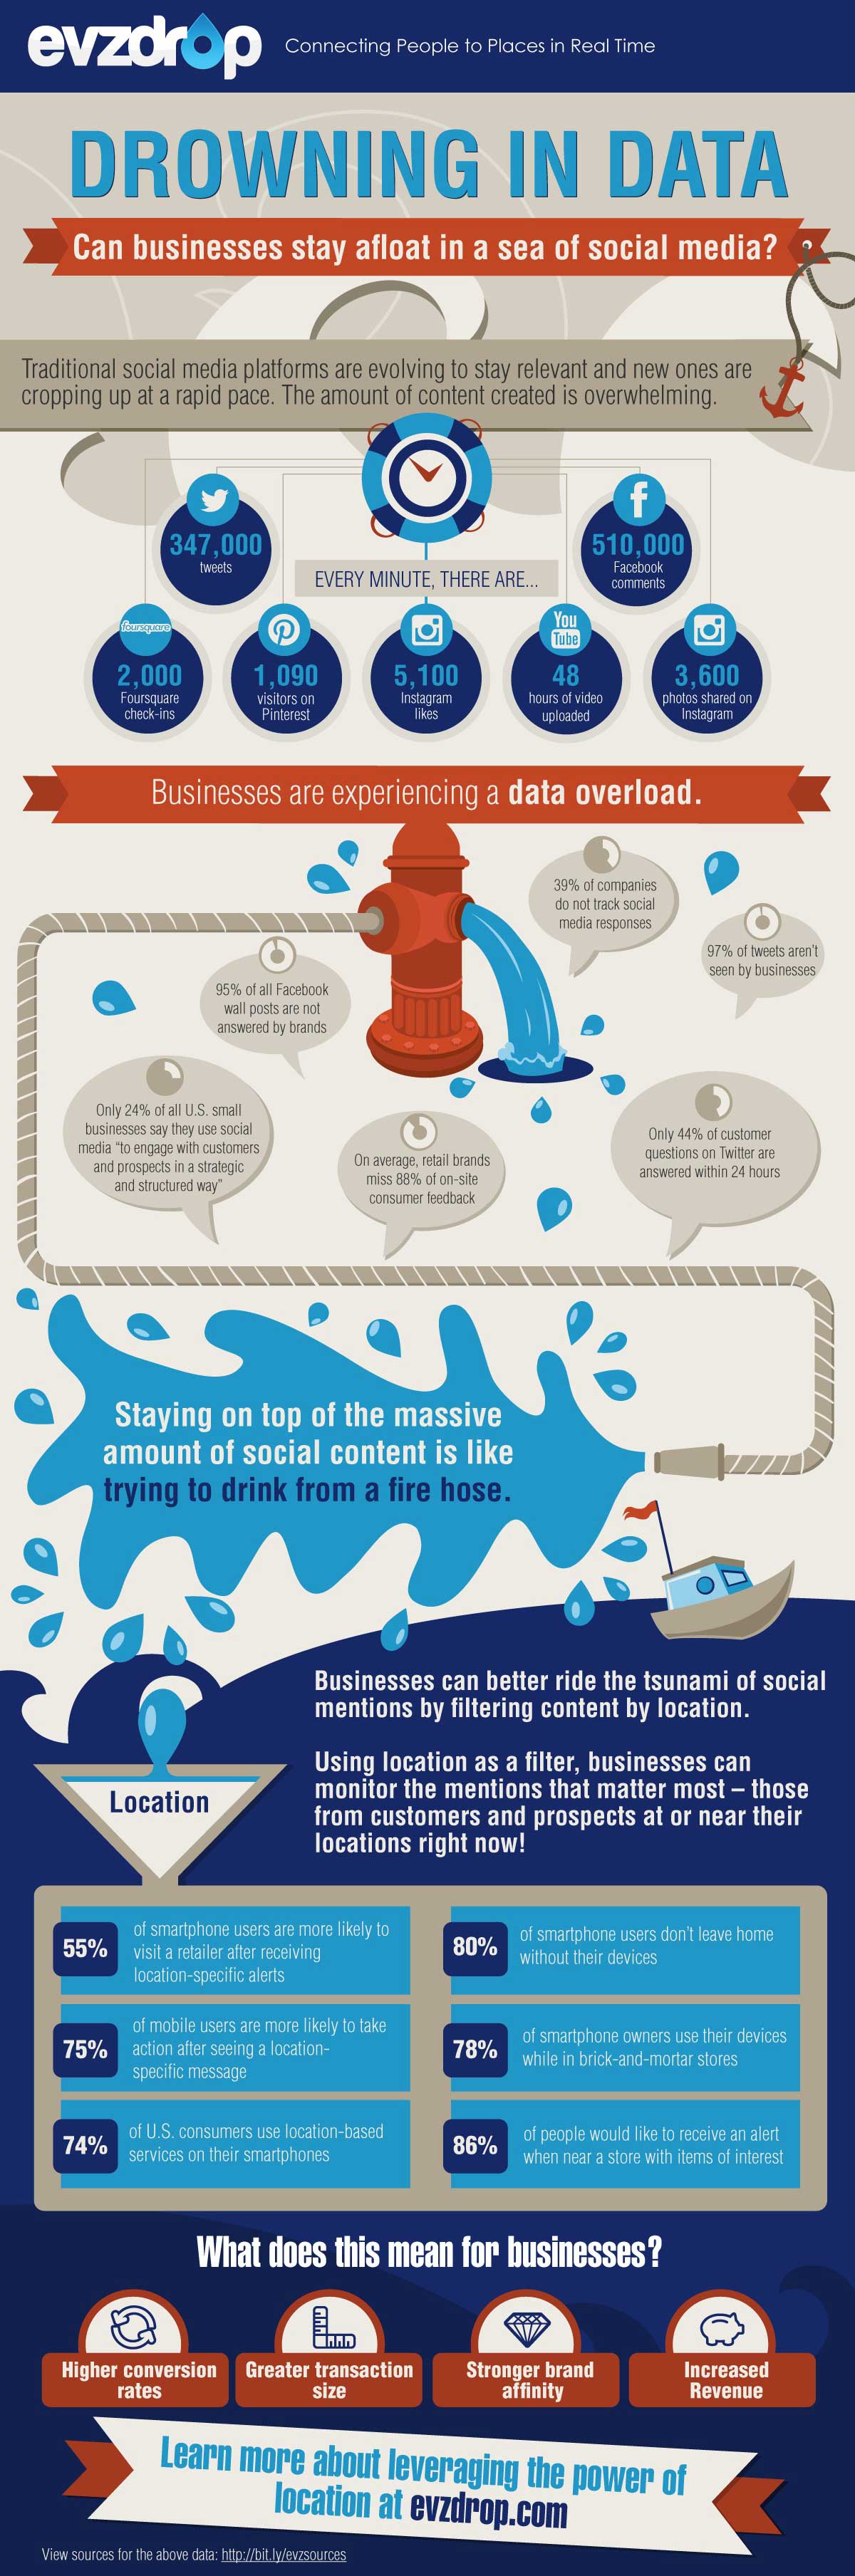
Some 80% of smartphone users don't leave home without their devices. So, wherever users are, they continue receiving updates, emails, and other forms of info. The deluge of information is steady and powerful.
As social media platforms continue to evolve at an unprecedented rate, businesses find it increasingly difficult to stay on top of all the data.
To show how much data is being shared (and to see what all that data means for businesses), Evzdrop created this infographic, according to which in just one minute...
- 347,000 tweets are shared.
- 510,000 Facebook comments are made.
- 5,100 Instagram photos are liked.
- 48 hours of video are uploaded on YouTube.
With all that happening in just 60 seconds, many businesses feel overwhelmed by the data. Some 97% of tweets aren't seen by businesses; 95% of all Facebook Wall posts aren't answered by brands; and only 44% of customer questions on Twitter are even answered within 24 hours.
"Staying on top of the massive amount of social content is like trying to drink from a fire hose," according to Evzdrop.
Doing that isn't impossible—not if you control how much data is filtering through. For example, Evzdrop suggests, you can use location as a filter. You can then just monitor the mentions from customers or prospects in your area.
For more ideas on handling the deluge of data, check out the following infographic: