Total measured advertising expenditures reached $31.3 billion in the first quarter of 2010, up 5.1% from the same period a year earlier—the first increase in quarterly ad spending since the first quarter of 2008 and the largest gain since the first quarter of 2006—according to data from Kantar Media.
"With the economy turning from recession towards growth, marketers appear to be more confident about a pickup in consumer activity and have increased ad budgets to support their brands," said Jon Swallen, SVP Research at Kantar Media. "While the rising tide has thus far benefitted some media sectors more than others, Q1 spending hikes were broadly distributed across advertisers and categories and that's an encouraging signal for the market going forward."
Below, measured ad expenditure-related data and analysis from Kantar Media.
Measured Ad Spending by Medium
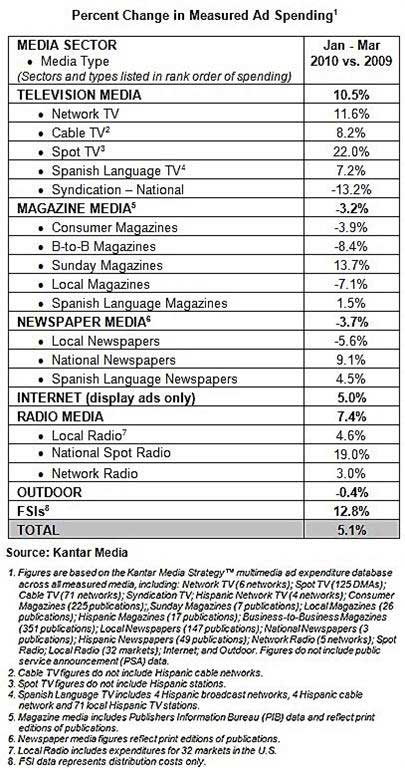
Among TV Media categories, all but one (National Syndication) registered improvements in the first quarter:
- After severe losses in 2009, Spot TV surged 22.0% on spending infusions from the automotive, retail, financial services, and political categories. Despite that growth, current spending volume in Spot TV has merely recovered to levels last recorded in 1997.
- Network TV expenditures received a boost from the Winter Olympics and finished the quarter up 11.6%.
- Cable TV (up 8.2%) and Spanish Language TV (up 7.2%) benefitted from selling more ad time on stronger demand from a broad range of package goods and retail advertisers.
After a three-year slump, National Spot Radio grew 19.0%, benefitting from higher spending from the telecom, financial services, and auto categories. Local Radio (up 4.6%) and Network Radio (up 3.0%) also improved in the quarter.
Print media, on the whole, continued to lag the overall ad market in the first quarter:
- Consumer Magazine spending fell 3.9% from a year earlier.
- Local Newspapers dropped 5.6%.
- There was improvement in some narrow segments, such as Sunday Magazines, which increased 13.7%, and National Newspapers—up 9.1%, primarily from gains at the Wall Street Journal.
Ad Spend by Category
Expenditures among the 10 largest advertising categories rose 7.8% in the first quarter, to $17.95 billion. All but one of the Top 10 categories was up, indicating broad participation in the ad recovery.
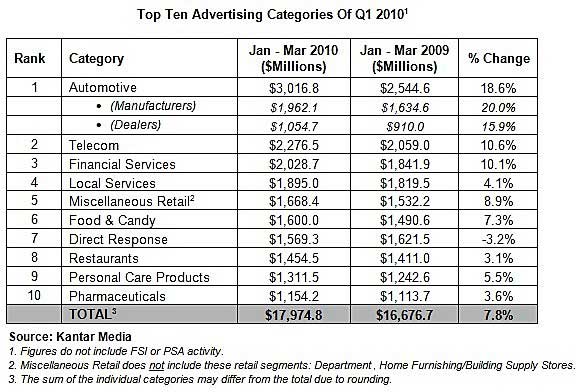
- Automotive was the leading category in spending volume and growth among the Top 10—reaching $3,016.8 million, up 18.6%, and ending a streak of 18 consecutive quarterly declines. Manufacturers and dealerships reacted quickly to an improving sales environment by ramping up marketing efforts, with TV, magazines, and radio the main beneficiaries.
- Telecom was the second largest category, with $2,276.5 million in expenditures, up 10.6%.
- Financial Services spending increased 10.1%, to $2,028.7 million, boosted by higher spending from marketers of credit cards and loan products—which offset continued weakness within the consumer banking segment.
- Packaged goods advertisers, who had taken advantage of soft ad pricing in 2009, were undaunted by rising ad prices in the first quarter of 2010. Spending from Food & Candy was up 7.3%, to $1,600.0 million, and expenditures for Personal Care Products increased 5.5% to, $1,311.5 million.
- Restaurant category spending rebounded modestly, with a 3.1% increase, to $1,454.5 million. A major contributor to the gain was McDonald's TV sponsorship of the Winter Olympics.
Looking for great digital marketing data? MarketingProfs reviewed hundreds of research sources to create our most recent Digital Marketing Factbook (May 2010), a 296-page compilation of data and 254 charts, covering email marketing, social media, search engine marketing, e-commerce, and mobile marketing. Also check out The State of Social Media Marketing, a 240-page original research report from MarketingProfs.
Ad Spend by Advertiser
The top 10 advertisers in the first quarter spent a combined $4.34 billion, up 10.6% from a year earlier.
Among the Top 100 advertisers, a diverse group accounting for nearly one-half of the measured-ad economy, spending increased 11.0%, to $14.89 billion. However, the long tail of small advertisers—defined as those outside the Top 1,000—registered a 1.1% decline in their aggregate media investments.
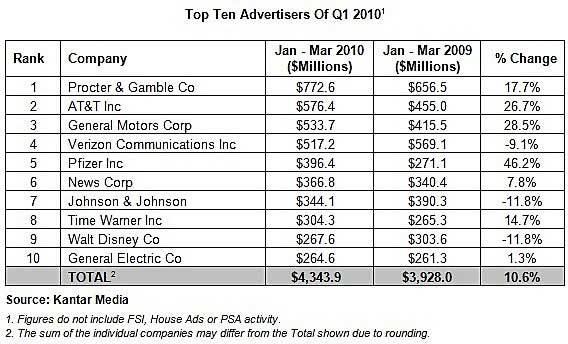
- Procter & Gamble kept its position as the largest advertiser, with $772.6 million in spending, up 17.7% from a year earlier. The company continued to shift budgets toward magazines and away from television.
- AT&T rose to the second spot with spending of $576.4 million, up 26.7%, due to a large TV ad buy in the Winter Olympics. Meanwhile, Verizon Communications reduced its total expenditures 9.1%, to $517.2 million. Both telecom companies continued to allocate more resources to promote their TV service products as they try to win subscribers from cable and satellite operators.
- Pfizer posted the highest spending growth rate, up 46.2%, to $396.4 million, as it maintained aggressive marketing support for Lipitor prior to the brand's going off patent in 2011.
- With auto industry sales picking up, General Motors accelerated its spending 28.5%, to $533.7 million, accounting for more than one-fourth of all ad dollars spent by auto manufacturers.
- News Corp (up 7.8%, to 366.8 million) and Time Warner (up 14.7%, to $304.3 million) registered notable gains, primarily driven by their movie studio divisions.
Branded Entertainment
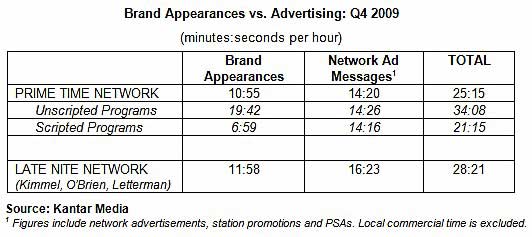
In the first quarter of 2010, an average hour of monitored primetime network programming contained 10 minutes, 55 seconds (10:55) of in-show brand appearances and 14:20 of network commercial messages. The combined total of 25:15 of marketing content constitutes 42% of a primetime hour.
Other brand-appearance-related findings:
- Unscripted reality programming had an average of 19:42 per hour of brand appearances, compared with just 6:59 per hour for scripted programs such as sitcoms and dramas.
- Late-night network talk shows had an average of 11:58 per hour. The combined load of brand appearances and network ad messages in those late-night shows was 28:21 per hour, or 47% of total content time.
- The top 5 brands ranked by total amount of brand appearance time were Coca-Cola, Asics, 24 Hour Fitness Center, Brita Water Purifiers, and Yamaha Music Equipment.
Note: Kantar Media monitors branded entertainment within network prime time and late night programming. The tracking identifies brand appearances and measures their duration and attributes. Given the short length of many brand appearances, duration is a more relevant metric than a count of occurrences for quantifying and comparing the gross amount of brand activity that viewers are potentially exposed to in the program versus the commercial breaks.
About the data: Kantar Media tracks all media (print, radio, TV, internet, social media, and outdoors worldwide) for a full range of media insights and audience measurement.


