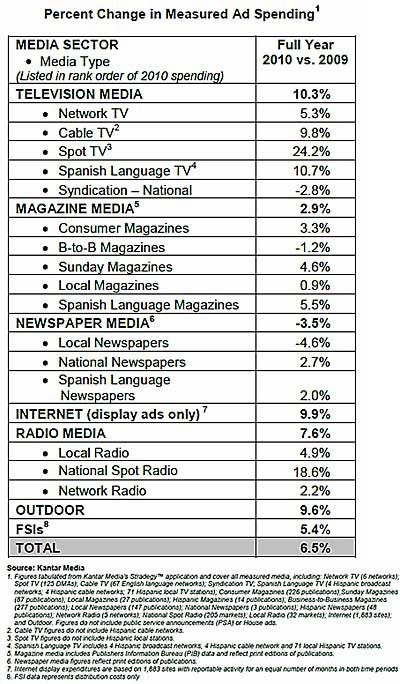
Total measured advertising expenditures increased 6.5% in 2010 over 2009 levels, to $131.1 billion, according to data released by Kantar Media. Ad spending in the fourth quarter of 2010 was up 7.0% compared with the same period a year earlier, driven by small advertisers ranked outside the Top 1,000.
"The feel good headline is the ad economy grew by 6.5% in 2010," said Jon Swallen, SVP of research at Kantar Media. "The more comprehensive assessment is that increased spending has not benefited all sectors equally. While television media have recouped their losses from the 2009 advertising downturn, several other large segments are still 15 to 20% below their 2008 peaks."
Below, measured ad expenditure-related data and analysis from Kantar Media.
Ad Spending by Medium

- TV ad spending was robust throughout 2010: Spot TV expenditures jumped 24.2% due to the biennial surge in political advertising, a revived auto category, and a pronounced budget allocation shift among retail bank advertisers. Spanish Language TV spending rose 10.7%, assisted by the World Cup. Higher sell-out levels helped lift Cable TV expenditures 9.8%, while healthy demand from CPG marketers and credit card companies pushed Network TV spending ahead 5.3%.
- Internet display advertising increased 9.9% over the previous year, the second largest growth rate among media sectors.
- Improvements in Radio advertising were skewed toward local markets: National Spot Radio spending increased 18.6% over 2009 levels and Local Radio grew 4.9%. In both radio segments, higher spending was driven by financial services, media, and auto dealer categories.
- Growth rates for print media trailed the overall ad market: Consumer Magazine spending grew a modest 3.3%, while National Newspapers rose 2.7%, primarily due to publishing expansion at the Wall Street Journal. Ad spending in Local Newspapers fell 4.6% from the previous year, despite a small uptick in the volume of space sold. Local Newspaper spending has now declined for 21 consecutive quarters.
Spending by Advertiser
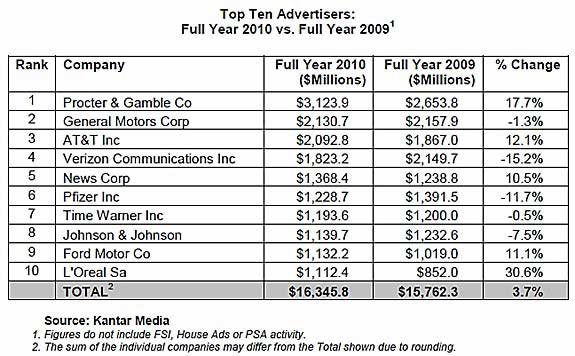
The top 10 advertisers of 2010 spent a combined $16,345.8 million, up 3.7% from 2009. Among the top 100 marketers, a diversified group accounting for close to one-half of all measured ad expenditures, investments climbed 8.8%.

Among the top 10 advertisers:
- For the eighth consecutive year, Procter & Gamble was the top advertiser with spending of $3,123.9 million, up 17.7% from 2009.
- L'Oreal posted the largest rate of increase among the top 10 with expenditures soaring 30.6%, to $1,112.4 million. The company boosted marketing support broadly across its portfolio of mass market and prestige cosmetics brands.
- Among auto manufacturers, Ford Motor increased total ad budgets 11.1%, to $1,132.2 million. Rival General Motors reduced spending slightly, down 1.3%, to $2,130.7 million. For both companies, exceptionally high levels of ad support in 4Q09 timed to the leading edge of the auto sales rebound made for difficult comparisons in 4Q10 and pulled down the full year growth rates.
- AT&T raised expenditures 12.1%, to $2,092.8 million as it continued to expand marketing efforts for its residential and mobile TV services. Verizon Communications trimmed ad spending 15.2 percent, to $1,823.2 million.
- Significant reductions were seen in the ad budgets of Pfizer (down 11.7%, to $1,228.7 million) and Johnson & Johnson (down 7.5%, to $1,139.7 million).
Looking for great digital marketing data? MarketingProfs reviewed hundreds of research sources to create our most recent Digital Marketing Factbook (May 2010), a 296-page compilation of data and 254 charts, covering email marketing, social media, search engine marketing, e-commerce, and mobile marketing. Also check out The State of Social Media Marketing, a 240-page original research report from MarketingProfs.
Ad Spending by Category
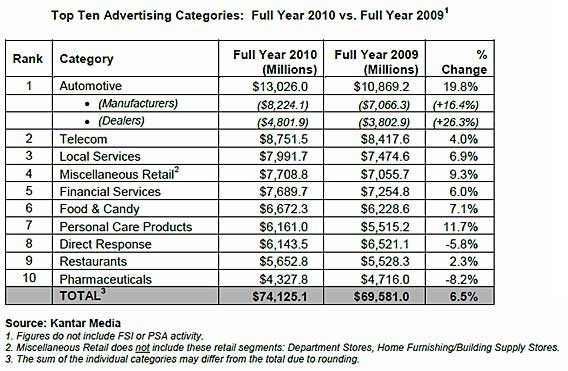
Expenditures among the 10 largest advertising categories totaled $74,125.1 million, up 6.5% from the $70,738.4 reported in 2009.

- Automotive was the leading category in both dollar volume and growth rate, finishing 2010 at $13,026.0 million, up 19.8%. Category spending grew almost twice as fast as new vehicle sales (19.8% vs. 11.1%), reflecting a fiercely competitive marketing environment for manufacturers and dealers.
- Telecom was the second-largest category with 2010 budgets rising a modest 4.0%, to $8,751.5 million. Lower spending by wireless carriers and satellite TV companies was offset by higher outlays from cable TV service providers.
- Package goods advertising remained active at year end as a broad range of manufacturers sought to defend market share against value-priced store brands and generics. Expenditures for Personal Care Products were up 11.7%, to $6,161.0 million and the Food & Candy category rose 7.1%, to $6,672.3 million.
- Ad spending for Financial Services increased 6.0%, to $7,689.7 million. In the aftermath of the financial crisis, marketing activity has picked up noticeably for products related to debt (credit cards, consumer loans) while advertising budgets for savings related segments have lagged (investments, retail banking).
- Only two of the top 10 categories experienced year-over-year declines: Direct Response budgets fell 5.8%, to $6,143.5 million. Pharmaceutical expenditures dropped 8.2% to $4,327.8 million, the lowest dollar amount for this category since 2003.
Branded Entertainment
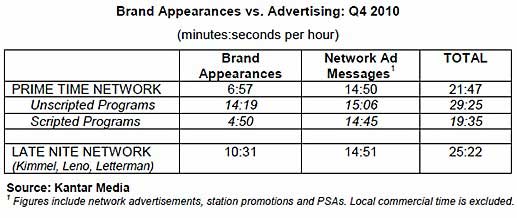
In the fourth quarter of 2010, an average hour of monitored prime time network programming contained 6 minutes, 57 seconds (6:57) of in-show brand appearances and 14:50 of network commercial messages. The combined total of 21:47 of marketing content constitutes 36% of a prime-time hour.

Other findings:
- Unscripted reality programming had an average of 14:19 per hour of brand appearances, compared with just 4:50 per hour for scripted programs such as sitcoms and dramas.
- Late-night network talk shows averaged 10:31 per hour of brand appearances. The combined load of brand appearances and network ad messages in those late night shows was 25:22 per hour, or 42% of total content time.
- The top 5 ranked by number of brand appearances were: Chef Revival, Cybex exercise equipment, Yamaha music equipment, Bud Light beer, and Asics footwear.
Note: Kantar Media monitors branded entertainment within network prime time and late night programming. The tracking identifies brand appearances and measures their duration and attributes. Given the short length of many brand appearances, duration is a more relevant metric than a count of occurrences for quantifying and comparing the gross amount of brand activity that viewers are potentially exposed to in the program versus the commercial breaks.
About the data: Kantar Media tracks all media (print, radio, TV, internet, social media, and outdoors worldwide) for a full range of media insights and audience measurement.


