Google's Android is still the top smartphone operating system (OS) in the Millennial Media ad network, but Apple's iOS regained some lost ground in March 2011, on the strength of the Verizon iPhone, according to Millennial Media's Mobile Mix report.
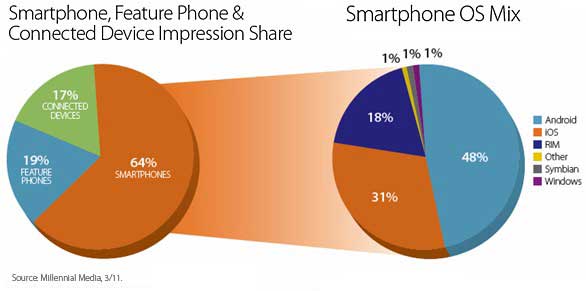
Overall, smartphones* accounted for 64% of all ad impressions on the Millennial Media ad network in March. Among key findings in March:
- Apple's iOs accounted for 31% of all ad impressions, up 11% from February.
- Android accounted for nearly one-half (48%) of all ad impressions.
- RIM grew 29% to capture 18% of all ad impressions, likely due to the increasing popularity of the BlackBerry Torch, according to Millennial Media.
- Nokia's Symbian and Microsoft's Windows Phone remained flat, each retaining a 1% share.
Below, other findings from Millennial Media's Mobile Mix report, based on March 2011 network data.
Apple devices (iPhone, iPad, and iPod Touch) accounted for 32.08% of all mobile ad impressions in Millennial Media's network, up 14% from February. Apple iPhone grew 17% during the month, driven by the Verizon iPhone, which accounted for 8.2% of the US iPhone impressions.
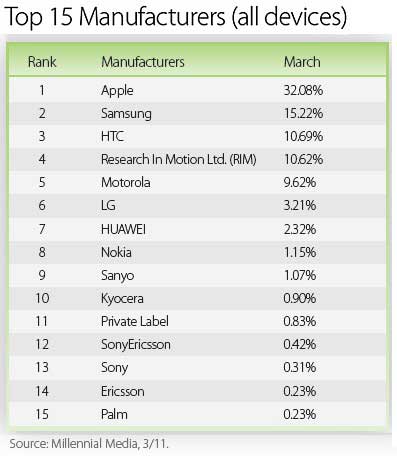
Among Android manufacturers, Samsung kept its No. 2 spot for the second consecutive month with 15.22% of all ad impressions. Samsung had a total of four handsets on Millennial Media's top 20 mobile phone list: the Epic, with 2.6% of all mobile phone impressions, the Vibrant (1.39%), the Fascinate (1.28%), and the Freeform (1.1%).
In third place was HTC with a 10.69% share and six phones on the top 20 list, including the Evo in third place with 3.12% of all impressions among mobile phones, the Droid Incredible (1.81%), the G2 Touch Hero (1.15%), the Desire (1.03%), and the MyTouch Magic (0.90%).
RIM followed closely in fourth place with a 10.62% share. With 5.3% of all ad impressions, the BlackBerry Curve took the No. 2 spot on the top 20, just behind the iPhone.
Looking for great digital marketing data? MarketingProfs reviewed hundreds of research sources to create our most recent Digital Marketing Factbook (May 2010), a 296-page compilation of data and 254 charts, covering email marketing, social media, search engine marketing, e-commerce, and mobile marketing. Also check out The State of Social Media Marketing, a 240-page original research report from MarketingProfs.
Mobile Apps, Ranked by Revenue
Apple iOS apps accounted for 47% of apps revenues generated in March 2011, driven by iPad revenue, which doubled month over month in March. Android apps accounted for 36% of apps revenues during the period, followed by RIM (7%).

Gaming applications are the most popular apps category (accounting for 37% of apps revenue). followed by music and entertainment apps, social networking apps, mail and messaging apps, and news and current events apps.
*Smartphone data does not include what could be considered Smartphones running proprietary OS, e.g., the Samsung Instinct and LG Vu. Millennial Media defines a connected device as a handheld device that can access the mobile Web, but is not a mobile phone. Examples include Apple iPod Touch, Sony PSP, Nintendo DS, iPad, etc.
About the data: Findings from the Mobile Mix report are based on network data in March 2011.


