Google Analytics is an incredibly powerful tool for measuring digital performance.

It can also be quite overwhelming, especially when trying to figuring out which of the many available insights you should be paying attention to.

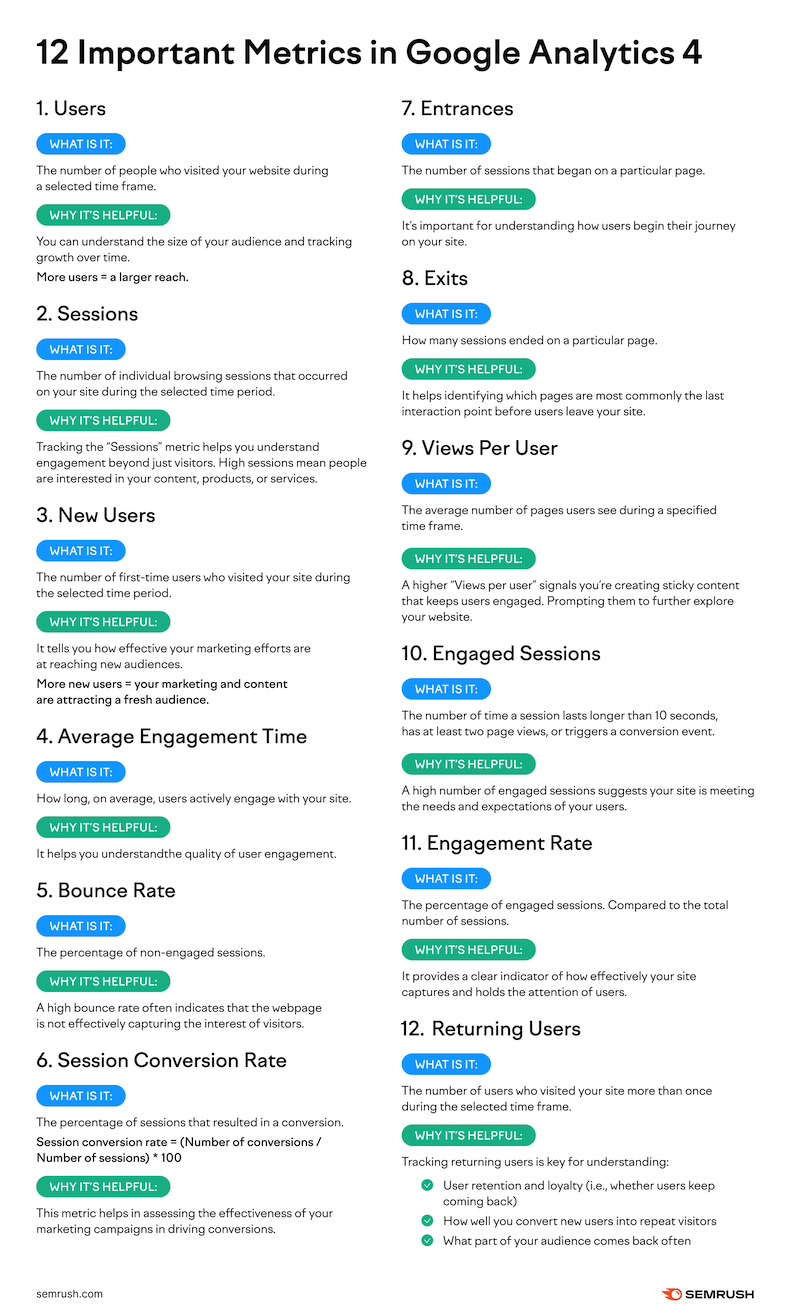
To help marketers navigate the platform better, Semrush created an infographic (below) covering the 12 key metrics to track in Google Analytics.

The infographic, which was based on this blog post, looks at what each metric is and why it's helpful.

Check it out:


Enter your email address to continue reading

12 Key Metrics to Track in Google Analytics [Infographic]

Don't worry...it's free!

Already a member? Sign in now.

Sign in with your preferred account, below.

Did you like this article?
Know someone who would enjoy it too? Share with your friends, free of charge, no sign up required! Simply share this link, and they will get instant access…
  • Copy Link

  • Email

  • Twitter

  • Facebook

  • Pinterest

  • Linkedin


ABOUT THE AUTHOR

image of Ayaz Nanji

Ayaz Nanji is a writer, editor, and a content strategist. He is a co-founder of ICW Media and a research writer for MarketingProfs. He has worked for Google/YouTube, the Travel Channel, and the New York Times.

LinkedIn: Ayaz Nanji

Twitter: @ayaznanji