It's been a tumultuous year for the advertising industry. In June 2020, GroupM estimated that the advertising economy will decline 10% globally in 2020. Money is tight, and it has become more critical to develop a cost-effective advertising strategy—justifying every cent spent.
Fortunately, advanced tools powered by Big Data or machine-learning have improved the science of analytics. But in this article I will explain the art of marketing analytics using only Excel, with the goal of preparing you for a data-driven advertising strategy.

Step 1: Examine return on advertising spend (ROAS)
Before writing down your new year KPIs, it is helpful to reflect on the previous year's advertising strategy. During such reviews, marketers sometimes overlook three high-impact issues: ad campaigns that were ineffective, the PPC budget setup, and attribution models.
1. Weed out ineffective advertising campaigns
If you spend more money than you are making from an ad, the campaign is probably ineffective.
Finding out how much you are spending on what is critical to optimizing your marketing budget. Focus on the most straightforward items: the cost of advertising and the resulting revenue. That way, you can flag the ineffective ads immediately and decide whether to terminate them.
At this stage, many companies adopt more than one tool to monitor and double-check the values in their cost/revenue calculations.

2. Examine your budget setup for PPC
Every marketer's nightmare: spending an entire month's budget on a pay-per-click (PPC) campaign on a single day because of some anomaly or improper settings.
As we move toward the post-pandemic period, new players and media partners will add more pricing fluctuations. A careful audit of your PPC settings will therefore help you avoid your nightmare. Key items to check include negative keywords, target audience, quality score, clickthrough rate, and ad text optimization.
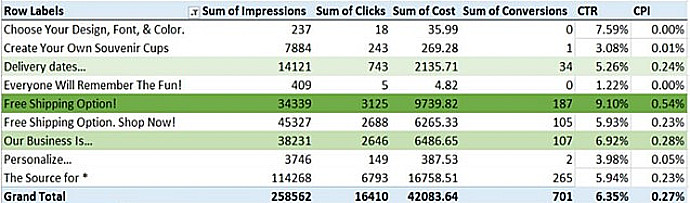
Here is a snapshot of my Pivot Table in Excel to validate data from Google AdWords.
3. Fine-tune your attribution model
Over 50% of marketers have adopted attribution reporting to see which channel has the largest impact. Last-click attribution, which gives 100% credit to the last ad click in a conversion path, has been widely used as the default in Google AdWords. However, does last-click match your business model?
Multiple new device types (smartphone and tablet) and evolving search behaviors (image and voice search) mean that insights from last-click attribution may be inaccurate or incomplete. It is worth doing an ad-hoc analysis on your 2020 campaign performance with alternative attribution models: time-decay, linear, and data-driven attribution. That will help you update your attribution algorithm to avoid missing opportunities in 2021.

Step 2: Analyze data for more than just cost and return
A deeper dive into analytics can uncover valuable information about audiences, trends, and design. Some campaigns may lose effectiveness in 2021 because the audience group has changed.
Here is a checklist that will guide you to harvest insights beyond cost and return:
- Clean and normalize your data set.
- Categorize data in ways that make business sense, and create segmentations accordingly.
- Conduct cohort analysis and funnel analysis.
- Analyze the effectiveness of keywords, products, and landing pages based on customer behavior data and change or remove those that reduce total ROAS.
- Analyze the interaction between channels to identify key touchpoints.
- Try attribution analysis until you find the most effective model for improving your ROAS.
How to convey the value of nonmonetary indicators and calculate ROAS?
I would like to introduce two valuation concepts from my college economic classes, which turned out to be particularly useful in evaluating marketing campaigns: Net present value (NPV) and efficient frontier.
1. Net Present Value
Net present value is the sum of cash flows (both positive and negative) associated with an investment, discounted to the present:
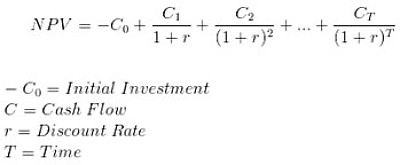
Marketers should understand the principle—if not necessarily the formula—because you can use the NPV function in Excel.
A negative NPV implies the campaign is ineffective in the long term.
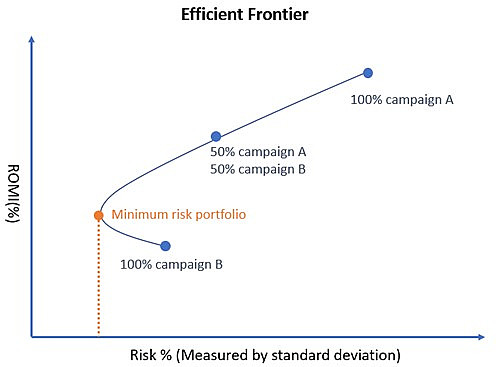
2. Efficient Frontier
After removing campaigns with a negative NPV from the table, how do you decide which campaigns are worth investing in more?
An efficient frontier model can help pick the winning portfolio based on return and risk. In a simple two-campaign scenario, you can use Excel (template provided) to plot different expected returns on advertising investment and risks by varying the proportion of each campaign.
As shown in the following graph, the goal is to find the minimum-risk combination of campaigns that provides the target return.
Step 3: Trust Data Analytics for Use in Budget Optimization

Some managers are skeptical of new data. Others trust it wholeheartedly because they believe game-changing insights may reside there.
To avoid using flawed data or judging by gut instinct alone, use a nuanced approach: small-scale A/B tests that help to increase conversions and save budget in the future. Use the test results to project future conversion levels to improve budget planning for your advertising campaigns.
Some popular A/B-test topics:
- Are consumers price-sensitive (showing discounts in ads)?
- Does location matter (displaying geographic features in ads)?
- Is selection important (offering exclusives, variety, customization)?
- What is the best CTA (using call, shop, find, or discover)?
Step 4: Automate budget management
At this stage, you can optimize your advertising budget in various ways to save overhead in 2021:
- Configure an automated bidding management system that can turn off keywords or initiate other activities
- Set automated control of daily budget limits
- Maximize remarketing and lead communications through emails
* * *
In the digital age, marketing without using data is like walking on the edge of a cliff in the dark. But don't feel overwhelmed by the advanced tools for statistical modeling and machine-learning. Establishing actionable data analytics in an Excel spreadsheet can be enough to bring you winning marketing campaigns even in an uncertain future.
More Resources on Data Analytics in Advertising
Flowchart: Use the Right Digital Advertising Strategies and Metrics for Your Campaigns [Infographic]
Why Your Paid Social Is Failing, and Best-Practices for Social Advertising
How Marketers Can Protect Their Online Ad Dollars From Fraud